The Greatest
Hits.
Our most impactful, previously featured market intelligence and trading psychology breakdowns.

Strait of Hormuz: Your Prop Firm's Defensive Playbook
US-Iran tensions just closed the Strait of Hormuz. Oil prices are soaring, global risk aversion is spiking. Here’s how prop firm traders pivot to defense and capitalize o

Hawkish Tides & Bond Breakers: Prop Firm's Defensive Playbook
Rising bond yields are flashing red. With hawkish central banks and oil surging, your prop firm portfolio needs a defensive pivot. Learn how to navigate this fractured ma

Peace Dividend Paradox: Navigating Mixed Market Signals
The US-Iran peace deal sparked euphoria, but hawkish central banks and holiday liquidity gaps create a complex trading landscape. Learn to spot the real signals

Warsh's Hawkish Fed: Recalibrating Prop Firm Risk in a Triple-Divergence Market
The Fed's unexpected hawkish shift, coupled with mixed global signals, demands a new playbook. Discover how to re-evaluate your risk models and capitalize on emerging div

BOJ's Historic Rate Hike: Will the Yen Break Free from Ultra-Loose Policy?
The Bank of Japan has officially raised its benchmark interest rate to 1%, marking its highest policy rate since 1995. Here is the prop firm playbook for trading JPY.

Warsh's Crucible: Trading the Fed's Political-Monetary Tightrope
New Fed Chair Kevin Warsh faces a high-stakes test, balancing inflation and political pressure. This isn't just a rate decision; it's a credibility battle with profound i

The Great Yen Unwind: Navigating BOJ's Paradigm Shift
Japan's rate hike shatters decades of carry trade dogma. Prop firm traders must adapt or face the brutal unwinding of long-held JPY shorts

Navigating the ECB's Imminent Rate Hike: How Prop Firm Traders Can Position for Euro Volatility Post-June 11
The near-certain ECB rate hike on June 11, driven by inflation and geopolitical energy shocks, presents a clear catalyst for EUR pairs. Prop firm traders must analyze the ECB's forward guidance and new macroeconomic projections to anticipate sustained Euro strength or a 'buy the rumor, sell the news' reaction.

Schwab Scraps PDT: Unleash Your Inner Prop Trader
The PDT rule is dead. This isn't just freedom; it's a mandate for hyper-disciplined intraday strategy. Here's how to leverage it without blowing up your account

Divergent Volatility: Navigating the Nexus Amidst Mixed Signals
Today's markets are a masterclass in conflicting narratives. Geopolitical oil shocks, a surging USD, and crashing Asian tech create a treacherous 'Divergent Volatility Ne

USD/JPY 160: Prop Firm Survival Guide to BOJ Intervention
USD/JPY is testing 160.00, a critical line in the sand for the BOJ. Learn how to navigate potential intervention without blowing your prop firm account
Geopolitical Pendulum: Trade Volatility, Central Bank Divergence
Middle East tensions swing oil and safe havens. Central banks react divergently. Learn how to navigate the ensuing volatility and profit from macro shifts without getting

AI Paradox: S&P 500's Fragile Rally & Hidden Risks
The S&P 500 is soaring on AI euphoria, but beneath the surface, a concentrated rally and rising yields hint at deep vulnerabilities. Prop firm traders, don't get caught o

Geopolitical & Inflationary Pressure: Trading Forex Majors in the Crosshairs
The US-Iran conflict and persistent inflation create a volatile cocktail for forex majors. Understand how safe-haven flows, oil prices, and hawkish central banks are shap

The 90% Certainty Trap: How Consensus Positioning Creates Post-Earnings Traps
Polymarket shows a 90% implied probability that Nvidia beats earnings tonight. We analyze how high consensus positioning creates asymmetric downside risk and how to trade it.

The Nvidia Earnings Playbook: Managing Risk Pre, During, and Post-Print
With consensus expecting a massive 120% growth rate, tonight's Nvidia Q1 print is the most critical event of 2026. We deliver the definitive trading playbook.

Nvidia's 4 Consecutive Earnings Beats: How to Trade a Beat-and-Raise Cycle
Nvidia has beaten consensus EPS estimates for four straight quarters. We break down the entry timing mechanics, the 'raise' signal, and how to position before and after May 20 earnings.

The Hormuz Trader's Playbook: Positioning for Ceasefire vs Escalation Binary
With a 14-point Iranian proposal on the table and ship seizures in the Strait, oil markets are at a knife's edge. Here is your weekend strategy.

SpaceX IPO S-1: How Mega-Cap IPOs Distort Index Flows and What Traders Should Expect
With the SpaceX prospectus imminent and a $2 trillion valuation target, the Nasdaq's 'Fast Entry' rule is set to trigger massive rebalancing.

The Powell Era Ends: What a Warsh Fed Means for Rate Expectations
As Kevin Warsh prepares to succeed Jerome Powell, markets must recalibrate their long-term rate expectations amidst sticky inflation and hawkish dissent.

Prop Firm Survival: Navigating Back-to-Back Inflation Spikes
With PPI following a hotter-than-expected CPI print, funded traders must implement strict volatility protection protocols to survive the inflation whip.

Trading FOMO During the Trump-Xi Geopolitical Summit
As the high-stakes US-China summit begins, we analyze the psychological trap of trading geopolitical uncertainty and how to manage headline FOMO.

Bank of Japan Delivers Hawkish Surprise Amid Iran Energy Spillover
While holding rates at 0.75%, the BoJ sharply revised inflation forecasts upward, citing elevated crude oil prices and signaling a growing hawkish minority.

Hot US CPI Print Kills 2026 Rate Cut Hopes as Energy Costs Surge
Headline CPI hits 3.8% YoY, shattering expectations and driving Treasury yields higher as traders price out any potential Federal Reserve rate cuts for 2026.

The ATH Trap: Why Volume Divergence at Record Highs Signals a Liquidity Flush
As markets touch new all-time highs, a subtle divergence in trading volume is creating a 'Liquidity Trap' for retail traders. We analyze the technical signatures of the coming flush.

Biological Optimization: The Hidden Engine of Trading Execution
Why do you 'paper-hand' winners and 'revenge trade' losers? The answer isn't in your strategy—it's in your biology. Discover the biological basis for professional trading.

Mega-Cap Divergence: Alphabet Records vs. Meta’s CapEx Tumble
As Alphabet hits new highs on massive CapEx targets, Meta slides 7% despite a double beat. We analyze what this tech divergence means for funded trader liquidity.

The ML Infrastructure Boom: Google and Xcel Energy’s Massive Data Center Power Deal
As Xcel Energy and Google finalize a massive infrastructure deal, we analyze the impact of high-output energy on the future of predictive ML trading coaches.
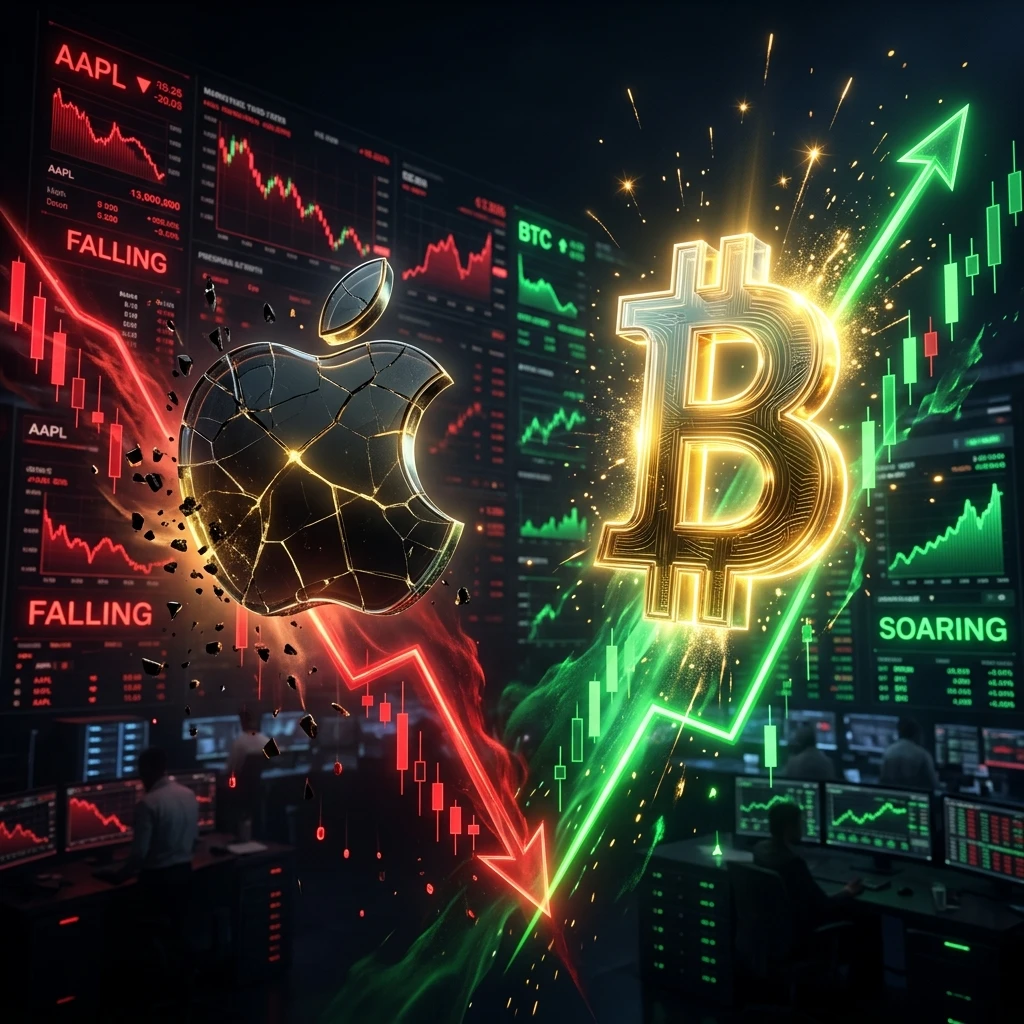
The Cook Departure: Apple Tumbles as Tech Titans Diverge
A shock resignation from Tim Cook sent Apple shares into a tailspin, overshadowing record earnings from Alphabet and Amazon. We analyze the resulting sector rotation.

Black Swan Protocol: Protecting Your Funded Account During CEO Shakeups
Sudden leadership changes at mega-cap firms like Apple can trigger 'Black Swan' volatility. Learn how to shield your prop firm account from liquidation when the news hits.

Mid-Week Liquidity: The Comprehensive Guide to Wednesday Reversals
Wednesdays often mark the structural pivot of the trading week. This guide breaks down the data behind mid-week liquidity shifts and how to navigate them using Toastlytics metrics.

Wednesday Whirlwind: Geopolitical Relief vs. Inflation Fears
Mid-week volatility hit a crescendo today as cooling Hormuz tensions clashed with rising US inflation expectations. We analyze the institutional tug-of-war.

Tuesday Turnaround: Spotting the Institutional Rotation
Following a volatile Monday open, the markets saw a classic institutional rotation today. We look at the data behind the 'Tuesday Turnaround' and why the NY session shifted sentiment.

Monday Momentum: Analyzing the Asian Session Liquidity Trap
Monday morning is the most dangerous time for retail traders. We break down the 'Fake-Out' data from this morning's open and how to avoid the 9:00 AM trap.

The Silicon Pulse: How Generative AI is Rewiring Trader Intuition
The era of the 'gut feeling' is evolving. Discover how generative models are acting as a cognitive bypass for traders, turning noise into actionable signal.

The 48-Hour Recovery: Anatomy of a Funded Account Rescue
We audited a 50k funded account that was 0.5% away from breach. Discover the data-driven steps that turned a near-failure into a payout.

Anatomy of a Losing Streak: 3 Hidden Signals the AI Coach Identifies Before You Blow Up
We trained our AI on 10,000+ failed trading sessions. Discover the 3 subtle data patterns that predict an account breach before it happens.

Why Spreadsheets are Dangerous: The Case for Emotion-Aware Journaling
Static spreadsheets are a liability for modern prop traders. Discover why emotion-aware journaling is the only way to build a sustainable trading career.

The Math of the Abyss: Why Drawdown is a Mathematical Trap
Recovering from a 50% loss requires a 100% gain. This is the 'Asymmetry of Loss.' This 2,000-word guide breaks down the math of recovery and how to avoid the point of no return.

Why Win Rate is a Vanity Metric: Introducing the Toast Score Standard
Is your 70% win rate making you go broke? Learn why high win rates are often a trap and how the Toast Score provides the institutional truth.

Weekly Recap: The Tech Resurgence vs. The Energy Crisis
Amazon and TSMC earnings are driving a tech resurgence, even as the Strait of Hormuz remains a primary macro risk. Here is how the two narratives are colliding.

The Hormuz Blockade: Navigating Geopolitical Volatility with Data, Not Gut
As Brent crude nears $100 following the naval blockade of the Strait of Hormuz, traders are facing a new era of risk. Learn how to audit your strategy for stagflationary shocks.

March Madness: How Last Month's Volatility Exposed Your Emotional Blindspots
Federal Reserve shocks, geopolitical shifts, and the resulting market tailspins made March 2026 a month for the history books. Explore how these macro events exposed the hidden errors in your trading execution.

The Funded Trader’s Secret: How to Keep Your Account for the Long Haul
Passing a challenge is only the beginning. 80% of funded traders lose their account before the first payout. This 1,800-word guide reveals the institutional-grade defense systems of the pros.

The $100k Reset: How Data Saved a Funded Account from the Brink
Explore the real-world case study of a $100,000 funded trader who hit a 4% drawdown in 48 hours—and how a single data-driven pivot saved the account from total liquidation.

The Prop Firm Blueprint: How to Pass Any Funding Challenge in 2026
Passing a $100k challenge isn't about finding a 90% win rate strategy. It's about mathematical risk management and staying under the radar of the drawdown algorithm.
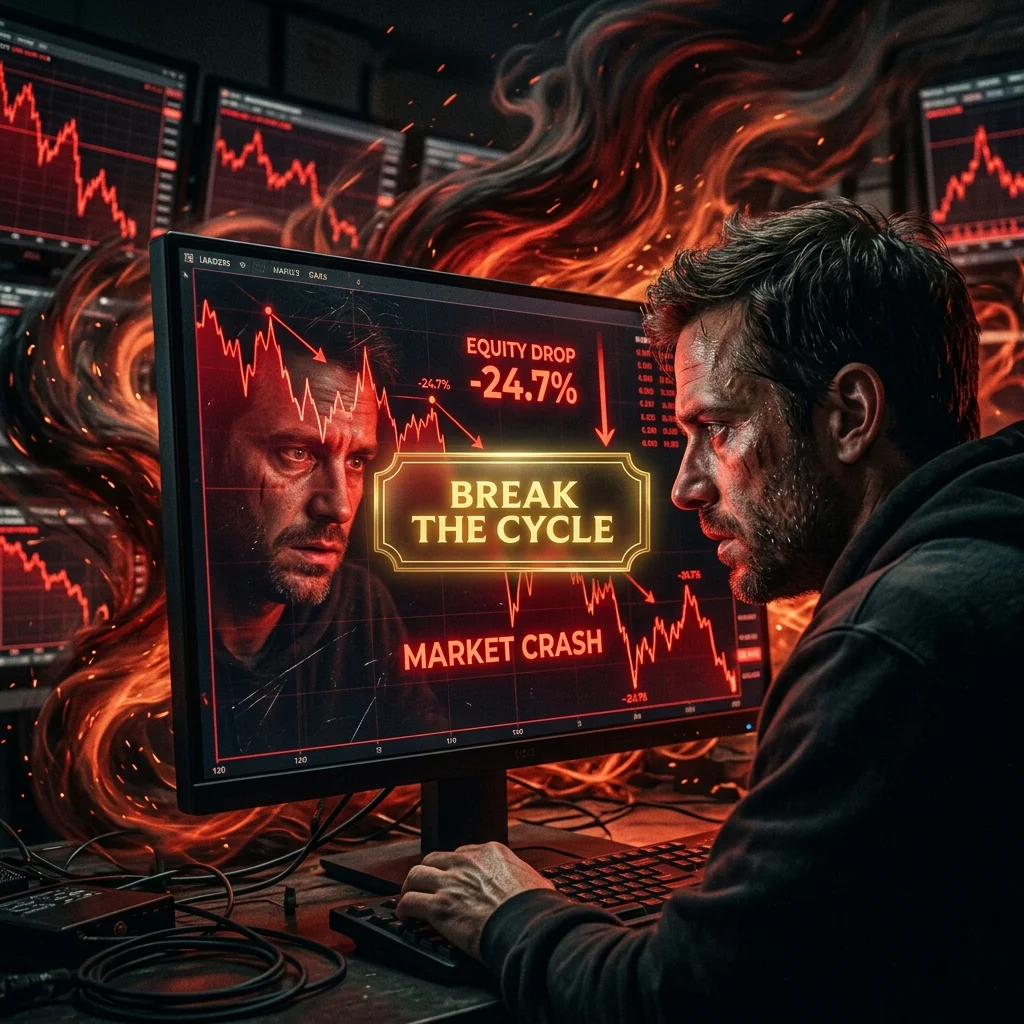
The Psychology of Losing Streaks: How to Stop Revenge Trading
Revenge trading is responsible for more blown accounts than any other single behaviour. Learn the neurobiology of 'Tilt' and how to use data to break the cycle permanently.

The Ultimate Trading Journal Guide: How to Turn Data into a Professional Edge
Most traders fail because they treat journaling as a diary. This 2,500-word research-backed guide shows you how to treat it as a profit-generation machine.