Market Pulse
Explore our latest insights and guides focused on market pulse.

US Hawkishness & Tech's Inflation Headache: Your Divergence Playbook
Sticky US inflation and strong GDP solidify the Fed's hawkish bias, anchoring USD. Meanwhile, tech faces an inflationary growth scare. Learn to trade this market fragment

Yen's Razor Edge: Trading BOJ's AI Hopes vs. Intervention Threat
The JPY is caught between BOJ's AI optimism and a looming intervention threat at 161.50, creating a high-stakes, two-way market for prop firm traders

US Economy's Two Speeds: Trading the Divergence as Tech Sells Off
Manufacturing surges while tech tumbles, creating a perilous split in the US economy. Discover how prop firm traders can navigate this divergence, manage risk, and find o

Bitcoin's Macro Tether: Trading BTC in a Hawkish Fed World
Forget crypto isolation. Today's market proves Bitcoin's fate is tied to the Fed and the dollar. Learn to navigate BTC's new reality and protect your prop firm capital

JPY Intervention: Navigating the 40-Year Low Crossroads
Japan's Yen is at a 40-year low, triggering intervention threats and inflation risks. For prop firm traders, this is a volatile crossroads demanding precision, strategy,

CHF's Invisible Ceiling: Trading SNB's Intervention Horizon
In a mixed market, the Swiss National Bank offers a rare predictable anchor. Learn how to leverage the SNB's intervention threat to find high-probability counter-trend op
Yen's Edge: Trading USD/JPY's Intervention Threshold
The Yen is testing BOJ's patience. With USD/JPY at multi-year highs despite a rate hike, prop firm traders need a framework to navigate potential intervention. Don't get

Asia's Uneven Peace Dividend: Trading the Lingering Scars
The US-Iran peace deal sparked global euphoria, but don't mistake broad market relief for a uniform recovery in Asia. We dissect why regional economies face persistent he
USD/JPY: Why Japan's Yen is a Trader's Divergence Play
Despite a BOJ hike, the Yen continues its slide. Japan's trade deficit is widening, creating a compelling divergence trade against the USD. Learn how to navigate interven

BOJ's Historic Rate Hike: Will the Yen Break Free from Ultra-Loose Policy?
The Bank of Japan has officially raised its benchmark interest rate to 1%, marking its highest policy rate since 1995. Here is the prop firm playbook for trading JPY.
Navigating the Great Divergence: Your Prop Firm Playbook
Markets are pulling in every direction today, from geopolitical peace to central bank tightening and tech euphoria. Forget simple narratives; here's how to profit from th

Peace Dividend Paradox: Why Today's Rally Demands Prop Firm Agility
A US-Iran deal ignited a risk-on rally, plunging oil and easing inflation fears. But don't mistake temporary relief for a permanent trend. Here’s how prop firm traders sh

ECB's Hawkish Echo: Why Peace Won't Kill Eurozone Inflation
The US-Iran peace deal crashed oil, yet the ECB hiked. This signals sticky inflation beyond geopolitics, forcing traders to rethink Eurozone rate bets and risk exposure

The 'Musk Effect' and Crypto's Crossroads: Analyzing the Impact of SpaceX's Blockbuster IPO on Digital Asset Flows and Market Sentiment
SpaceX's $2 trillion Nasdaq debut created the largest capital reallocation event in recent memory — and crypto bore the brunt. With Bitcoin below $65,000 and ETFs posting 13 consecutive days of outflows totaling $4.3 billion, prop firm traders face a complex setup where institutional approval and actual market behavior sharply diverge.

UK Inflation Expectations Soar: How the Iran War is Forcing the BOE's Hand and What it Means for GBP Traders
Bank of England surveys reveal Britons expect inflation to double the BOE's target — a significant signal that the UK's central bank faces mounting pressure to act. Simultaneously, the UK economy contracted in April. For GBP traders, this stagflationary crossroads creates high-volatility opportunities.

US Inflation and Jobs Data: The Fed's Dilemma and its Impact on Dollar Strength
CPI at 4.2%, PPI at 6.5% year-over-year, and NFP more than doubling expectations at 172,000 — three simultaneous data beats that create an undeniable Fed dilemma heading into the June 16-17 FOMC. For prop firm traders, this trifecta redefines the dollar outlook and every USD pair trade for the next month.

AI's Earnings Power Play: How Oracle's Report and Chip Sector Strength Are Shaping Tech Index Volatility
Oracle's earnings report and the chip sector's AI-driven strength are creating a bifurcated tech market. For prop firm traders with Nasdaq and S&P 500 exposure, understanding which parts of tech are leading, lagging, and at risk of correction is the difference between profits and painful drawdowns.

CPI Day Reckoning: Why Today's US Inflation Data is a Make-or-Break Moment for Fed Policy and Dollar Direction
Today's US CPI release is the single most important data point of the month for prop firm traders. Here is a complete breakdown of the scenarios, asset reactions, and risk management strategies you need to navigate this make-or-break moment for the dollar and interest rate expectations.

The Crypto Conundrum: Bullish Price Action Amidst Extreme Fear
Bitcoin rises while the Fear & Greed index screams Extreme Fear, presenting a complex conundrum for digital asset traders navigating mixed signals.

Dollar Dominance: How May's Blowout NFP Report Changes the Game
May's blowout NFP report has revived the higher-for-longer narrative, fundamentally shifting the near-term outlook for major forex pairs and requiring immediate strategic pivots.

Hawkish Hammer & Geopolitical Grinder: Trading Today's Dual Threat
Strong US jobs fueled Fed rate hike fears, crushing Nasdaq. Add geopolitical oil shocks, and you have a dual threat. Learn to navigate this volatility and find tactical p
AI Bubble or Correction? Decoding Tech's Divergence Amid Mixed Markets
The Dow hits records while Nasdaq dips on AI stock pullback. Is it a healthy rotation or a warning? Prop traders must navigate this dual market reality for precision and

Bitcoin's Macro Tangle: Outflows, Fear, and Your Prop Firm Edge
Bitcoin's record ETF outflows and extreme fear aren't just crypto noise. It's a macro-driven de-risking event, treating BTC as a high-beta risk asset. Here's how to adapt

Crypto's Two Speeds: Trading Institutional vs. Speculative Flow
Mastercard embraces stablecoins while Bitcoin ETFs bleed. Learn to navigate crypto's divergent forces and trade the real drivers of short-term price action

The AI Divergence Playbook: Navigating Tech's Ascent & Market Mix
Alphabet's massive AI investment highlights a two-speed market. Learn to leverage concentrated tech momentum while managing broader market volatility and concentration ri

ECB Hike Imminent: Prepping Your Euro Trades for June 10 Volatility
With a 92% chance of an ECB rate hike, the Eurozone is set for volatility. Learn how prop firm traders can strategically position and manage risk before the June 10 annou

US Data Week: Navigate the Fed's Hawkish Pivot
This week's ISM & labor data could validate or upend Fed rate hike bets. Prop firm traders must prep for divergent outcomes with precision and ironclad risk management

AI-Powered S&P 500: Geopolitical Storms Brewing for Index Traders?
Goldman Sachs raised its S&P 500 forecast to 8000 on strong AI earnings, but don't ignore escalating geopolitical tensions and hawkish central banks threatening this tech

Gold's Geopolitical Tug-of-War: Trading the Haven's Dilemma
Gold is caught between de-escalation hopes and a strong dollar. Learn how prop traders navigate XAU/USD's conflicting narratives for actionable short-term trades

Eurozone Inflation Accelerates: Why the ECB's June Rate Hike is Now a Near-Certainty
France, Italy, and Spain all posted inflation beats simultaneously — eliminating the ECB's last dovish escape route. Here's the EUR/USD trade setup for the June decision and why Panetta's 'no pre-commitment' language is deliberate misdirection.

Oil Down, Gold Up: How to Trade the Ceasefire-Inflation Divergence in Commodities
Oil and Gold are traditional safe havens and inflation hedges, but right now they are moving in opposite directions. Here is how prop firm traders can exploit this divergence as crude reacts to ceasefire headlines and gold reacts to sticky PCE inflation.

AI Paradox: S&P 500's Fragile Rally & Hidden Risks
The S&P 500 is soaring on AI euphoria, but beneath the surface, a concentrated rally and rising yields hint at deep vulnerabilities. Prop firm traders, don't get caught o

US Data Dump: Navigate Today's Volatility Vortex
Q1 GDP, PCE, Jobless Claims hit today. Understand the confluence of data and geopolitical crosscurrents to manage risk and exploit opportunity in USD pairs and indices

China's Profit Boom: The Divergent Demand Playbook
Geopolitical storms rage, but China's industrial surge from AI and oil creates a powerful counter-narrative. Learn to trade divergent demand without chasing headlines.

Central Bank Divergence: Trade the ECB & RBNZ's 'Wait & See'
While the RBNZ and ECB preach patience, their subtle shifts create powerful currency divergence. Learn to spot the hidden carry and trend opportunities in NZD and EUR pai

Michael Burry's Nvidia Warning: Is the Tech Rotation Finally Here?
The 'Big Short' investor has taken a massive put position against Nvidia. Is this the catalyst for the long-awaited tech sector rotation?

The Earnings Season Paradox: Why S&P 500 Concentration is a Hidden Risk
The S&P 500 looks healthy on the surface, but underneath, a dangerous concentration risk is brewing. How traders should navigate the earnings paradox.

Beyond the Hype: Why Nvidia's Stellar Earnings Couldn't Ignite a Broader Market Rally
Nvidia delivered record profits, but the market yawned. We break down the 'priced-in' paradox and what it means for tech sector traders.
BOJ's Hawkish Pivot: Unwinding the Great Yen Carry Trade
The Bank of Japan's potential June rate hike signals a seismic shift, unwinding decades of ultra-loose policy. Prop firm traders must re-evaluate JPY pairs, carry trades,

Retail Turnaround Trades: Spotting Inflections Before the Crowd in Target Earnings
Target stock is up 30% YTD ahead of earnings as same-store sales return to growth. We analyze the turnaround mechanics and how to identify retail trend inflections.

Biotech Speculation: Trading the Ebola Emergency Spikes and Fades
The WHO has declared an Ebola emergency, triggering algorithms to spike small-cap biotech stocks. We dissect the anatomy of pandemic speculation and how to trade the fade.

Pre-IPO Stock Splits: What They Signal and How to Trade the Listing Week
SpaceX's confirmed 5-for-1 stock split adjusts share price to $105.32 and values the company at $1.75T. Let's analyze what pre-IPO stock splits signal to secondary markets.

SpaceX S-1 This Week: The IPO Effect on Index Flows and What Traders Need to Know Before SPCX Lists
The SpaceX prospectus drops as early as May 22. With a $1.75–$2 trillion target valuation and xAI embedded, this is not just an IPO — it is the largest index rebalancing event in Nasdaq history.

SpaceX IPO S-1: How Mega-Cap IPOs Distort Index Flows and What Traders Should Expect
With the SpaceX prospectus imminent and a $2 trillion valuation target, the Nasdaq's 'Fast Entry' rule is set to trigger massive rebalancing.

First Hormuz transit in months — what it means for oil, inflation & risk sentiment
A Chinese supertanker has successfully exited the Strait of Hormuz after a two-month blockade, signaling a potential shift in oil war premiums.

Energy as Sticky Inflation: Iran Rebuilds Hormuz Missile Sites
US intelligence reports indicate Iran has restored access to 30 missile sites along the Strait of Hormuz, cementing energy as the primary driver of sticky global inflation.

Euro Battles Descending Channel Resistance Ahead of Critical US CPI Data
The EUR/USD hovers near $1.1760, pressing against key descending channel resistance as markets await US inflation data to dictate the next momentum shift.

Market Pulse: Nasdaq Hits Record High Despite Mega-Cap Tech Drop
The Nasdaq Composite and S&P 500 reached fresh record highs as resilient broader market participation offset notable declines in Magnificent Seven heavyweights.
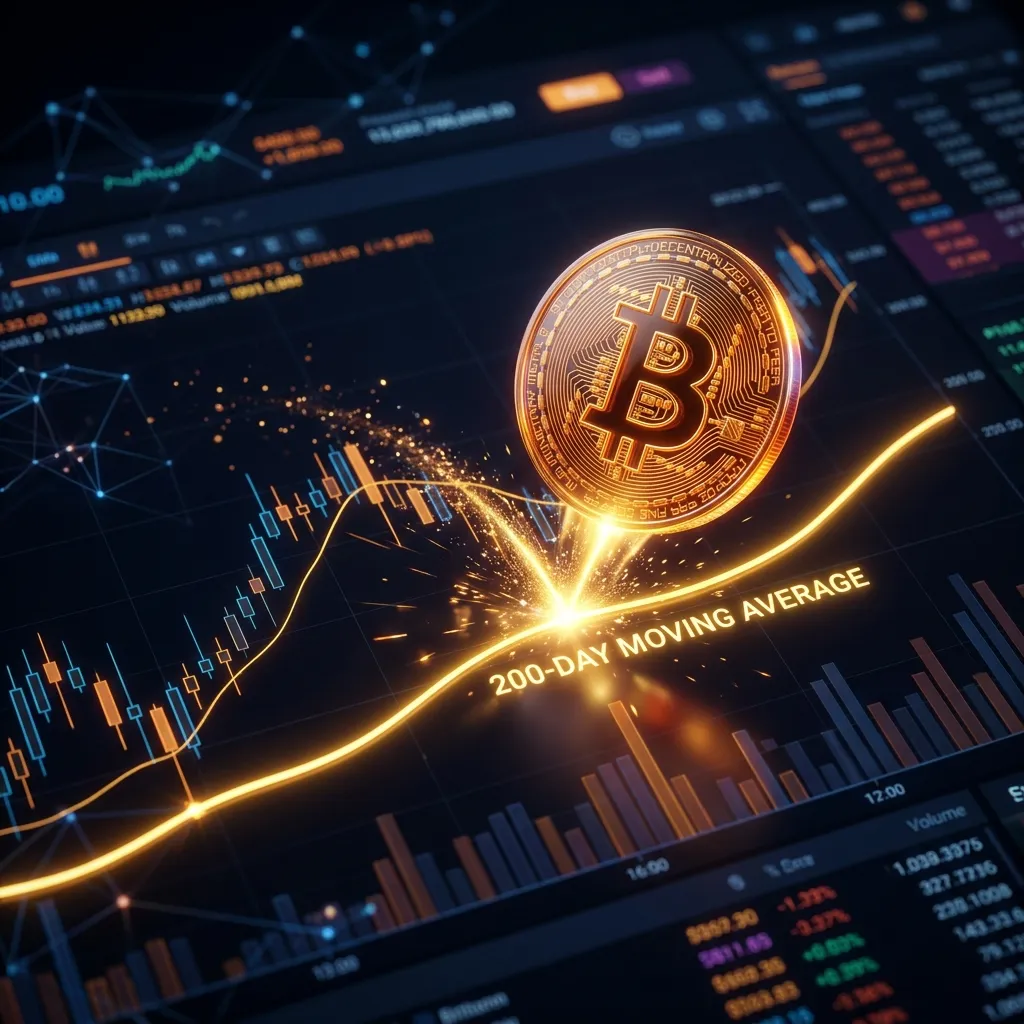
Bitcoin Bulls Defend the Line: Major Bounce Off 200-Day MA
Bitcoin has successfully defended its long-term trend line, bouncing off the 200-day moving average as institutional buyers step in to protect the current bull cycle.

Tech Diplomacy: Musk and Cook Join Trump for Xi Jinping Summit
Elon Musk and Tim Cook are set to accompany Trump for an upcoming summit with Xi Jinping, signaling a heavy tech focus on future trade relations, while Nvidia's Jensen Huang remains absent.
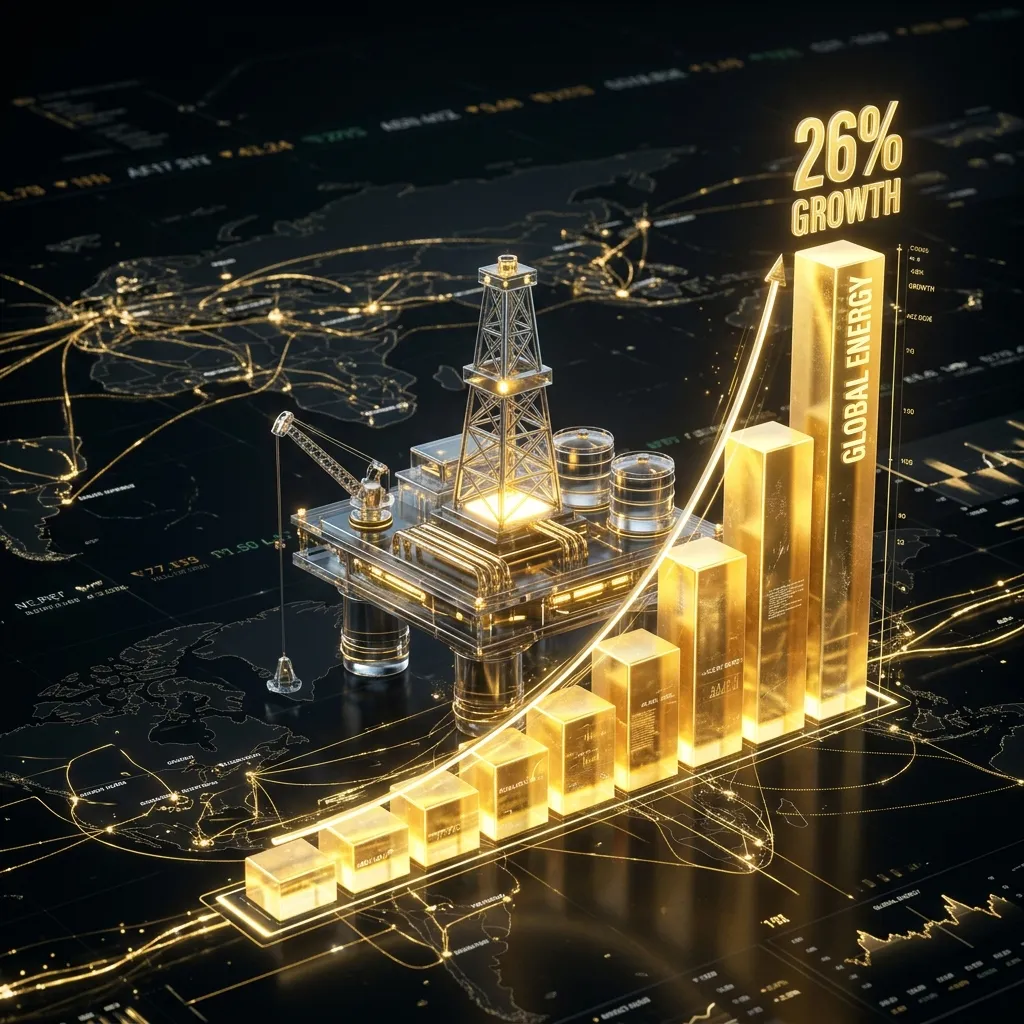
Energy Surge: Saudi Aramco Reports 26% Growth in Q1 Net Income
Saudi Aramco set the tone for energy markets with a 26% surge in Q1 net income, driven by robust demand and strategic pricing power.

Market Slide: Trump Rejects Iran Peace Offer, S&P Futures Drop
Market sentiment soured as Donald Trump dismissed a peace proposal from Iran, sparking a Gold correction and pressure on equity futures.

The ATH Trap: Why Volume Divergence at Record Highs Signals a Liquidity Flush
As markets touch new all-time highs, a subtle divergence in trading volume is creating a 'Liquidity Trap' for retail traders. We analyze the technical signatures of the coming flush.

Tech Tumble: Nasdaq Drops 1% Amid OpenAI Concerns and Chip Sell-Off
An alarming report regarding OpenAI triggered a broad sell-off in semiconductor stocks, dragging the Nasdaq Composite down 1% and highlighting AI sector vulnerability.

Starbucks Surges 6%: A Caffeine Boost for Consumer Sentiment
Starbucks stock rallied 6% after a strong earnings beat and raised full-year outlook, signaling robust consumer discretionary spending.

UBS Profits Surge 80%: The Trading Desk Renaissance
UBS reported an 80% profit surge to $3 billion, driven by exceptional trading desk returns. We analyze what this means for institutional volatility.

Chicago Grain Futures: Decoding the Energy Correlation Drift
Why are grain futures falling despite global supply concerns? Learn how retreating oil prices and US weather outlooks are creating a unique volatility cluster.

Mega-Cap Divergence: Alphabet Records vs. Meta’s CapEx Tumble
As Alphabet hits new highs on massive CapEx targets, Meta slides 7% despite a double beat. We analyze what this tech divergence means for funded trader liquidity.
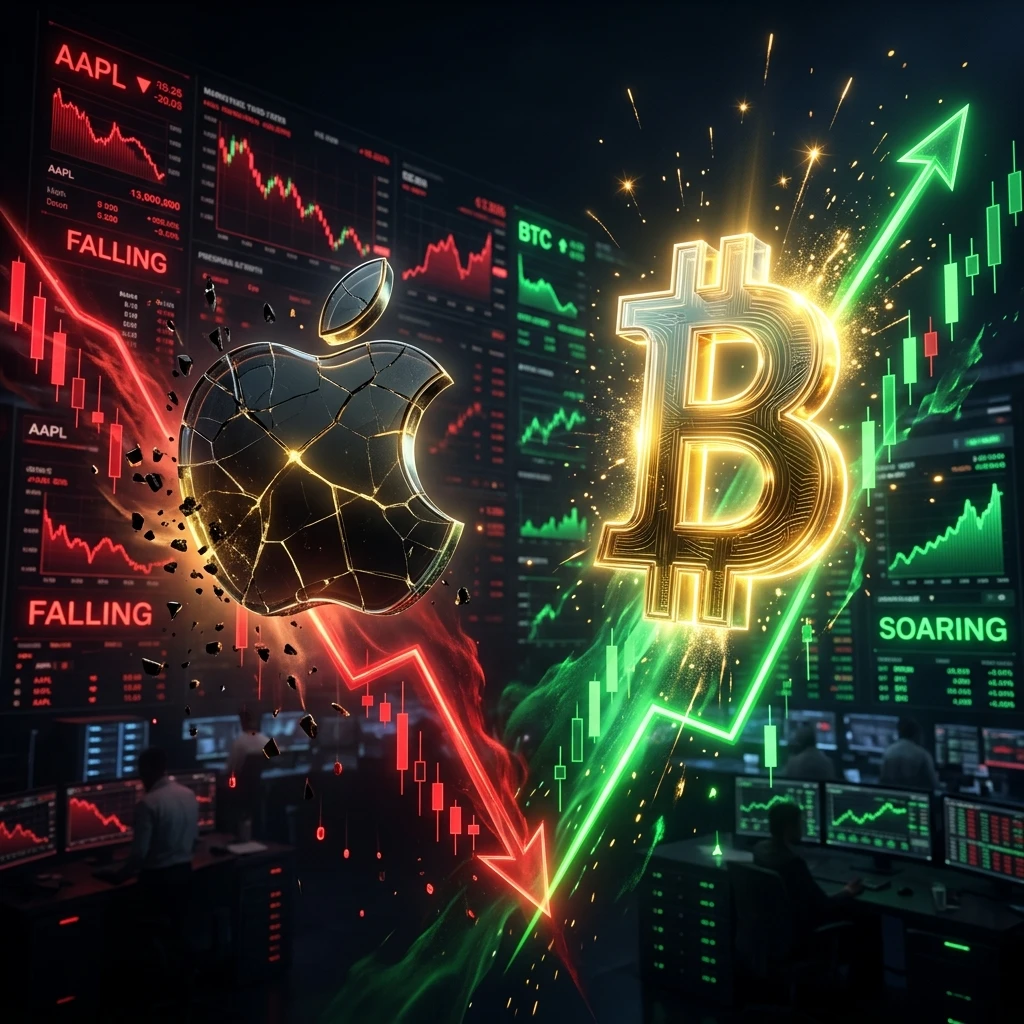
The Cook Departure: Apple Tumbles as Tech Titans Diverge
A shock resignation from Tim Cook sent Apple shares into a tailspin, overshadowing record earnings from Alphabet and Amazon. We analyze the resulting sector rotation.

Wednesday Whirlwind: Geopolitical Relief vs. Inflation Fears
Mid-week volatility hit a crescendo today as cooling Hormuz tensions clashed with rising US inflation expectations. We analyze the institutional tug-of-war.

Tuesday Turnaround: Spotting the Institutional Rotation
Following a volatile Monday open, the markets saw a classic institutional rotation today. We look at the data behind the 'Tuesday Turnaround' and why the NY session shifted sentiment.

Monday Momentum: Analyzing the Asian Session Liquidity Trap
Monday morning is the most dangerous time for retail traders. We break down the 'Fake-Out' data from this morning's open and how to avoid the 9:00 AM trap.
Sunday Market Prep: Positioning for the FOMC Hawkish Tilt
As the market opens for the final week of April, all eyes are on the Fed's next move. Here is how to audit your weekend exposure and prepare for the volatility ahead.

Friday Close: The April Performance Audit
The final Friday of April is here. It's time to close the books, audit your execution, and prepare for the transition into May.

The Roadmap to May: Preparing for the Next Sentiment Shift
As April winds down, the market is already looking toward May's Fed meeting. Here is how the 'Stagflation' narrative is evolving into the 'New Normal'.

Correlation Drift: When Gold and USD Stop Moving in Opposite Directions
Gold and the USD are moving in tandem, breaking traditional inverse relationships. Here is how to use Toastlytics to detect 'Correlation Drift' before it hits your stop-loss.

Payout Pressure: The Psychology of the End-of-Month Audit
As we approach the end of April, the pressure to hit payout targets is reaching a peak. Here is why the last 7 days of the month are the most dangerous for funded traders.

Sunday Focus: The 'Stagflation' Reality Check
The word 'Stagflation' is dominating the airwaves. As we prep for the week, the focus shifts to how the Fed will balance slowing growth with rising energy costs.

Weekend Recap: The Ceasefire Collapse and 'Safe Haven' Flight
The temporary ceasefire in the Middle East has collapsed, leading to a fresh spike in volatility. Here is how to prepare for the Monday gap.

Flash PMIs: The Global Growth Divergence Deepens
The latest Flash PMI data is out. While the US continues to expand, European manufacturing is showing signs of a 'stagflationary' slowdown.

Corporate Earnings: The Inflation Margin Squeeze
Delta Air Lines and Constellation Brands have reported. The data shows that while demand is high, rising fuel costs are beginning to eat into corporate margins.

The Hormuz Blockade: Navigating the 'War Premium' Peak
New reports of naval skirmishes in the Strait of Hormuz have pushed Oil to test the $100 psychological barrier. Here is how the 'War Premium' is impacting asset correlations.

ADP Hiring & PPI Inflation Spike: The Stagflationary Squeeze
Strong private hiring (185k) and a hot PPI print (+0.7%) are forcing the market to re-evaluate the Fed's pivot timeline. Inflation is proving stickier than the 'Soft Landing' bulls anticipated.

Sunday Prep: Positioning for the Inflation Data Drop
As we look toward a massive week of inflation data (ADP & PPI), the 'Sunday Prep' is more critical than ever. Set your session rules before the Monday open.

The Friday Flush: Auditing the 4 PM Liquidity Gap
As we close out a high-impact week, the risk of 'Headline Gaps' remains elevated. Protect your funded account with these three session rules.

The 'Higher for Longer' Reality: Auditing Institutional Drift
Following yesterday's Fed minutes, the 'higher for longer' narrative is cemented. Here is how institutional liquidity is shifting in the aftermath.
The FOMC 'Hawkish Hold' & EIA Crude Inventory Shock
The Fed keeps rates steady at 5.50% while US crude inventories see a massive 5.5M barrel build. The collision of hawkish policy and supply surplus is testing energy support levels.

Durable Goods & Ivey PMI Audit: The Growth Divergence
Durable goods orders remained flat while the Canada Ivey PMI surged to 63.8. This divergence between US manufacturing and Canadian services is creating unique cross-pair opportunities.

The Naval Escalation: Sentiment Analysis for the Week Ahead
As the naval presence in the Strait of Hormuz increases, the market is bracing for a supply-side shock. Here is how to audit your sentiment bias.

US Balance of Trade: The Fundamental Floor for the USD
Fresh data shows the US trade deficit narrowing slightly in February 2026. This shift provides a fundamental floor for the US Dollar despite rising energy costs.

Weekend Briefing: Auditing the 'Hormuz Premium'
As the markets close for the weekend, the 'Hormuz Premium' is being baked into long-term options. Here is how to audit your weekend exposure.

Energy Sentiment: Why $90 Crude is the New Floor
Oil remains the primary driver of market sentiment today. With prices stabilizing above $90, the correlation between energy and inflation expectations is tightening.

Q2 Opening: The Volatility Outlook and the 'Liquidity Gap' Trap
As we enter the second quarter of 2026, the market is pricing in sustained geopolitical risk. Here is how to position your execution rules for the new volatility standard.