Trade smarter.
Think clearer.
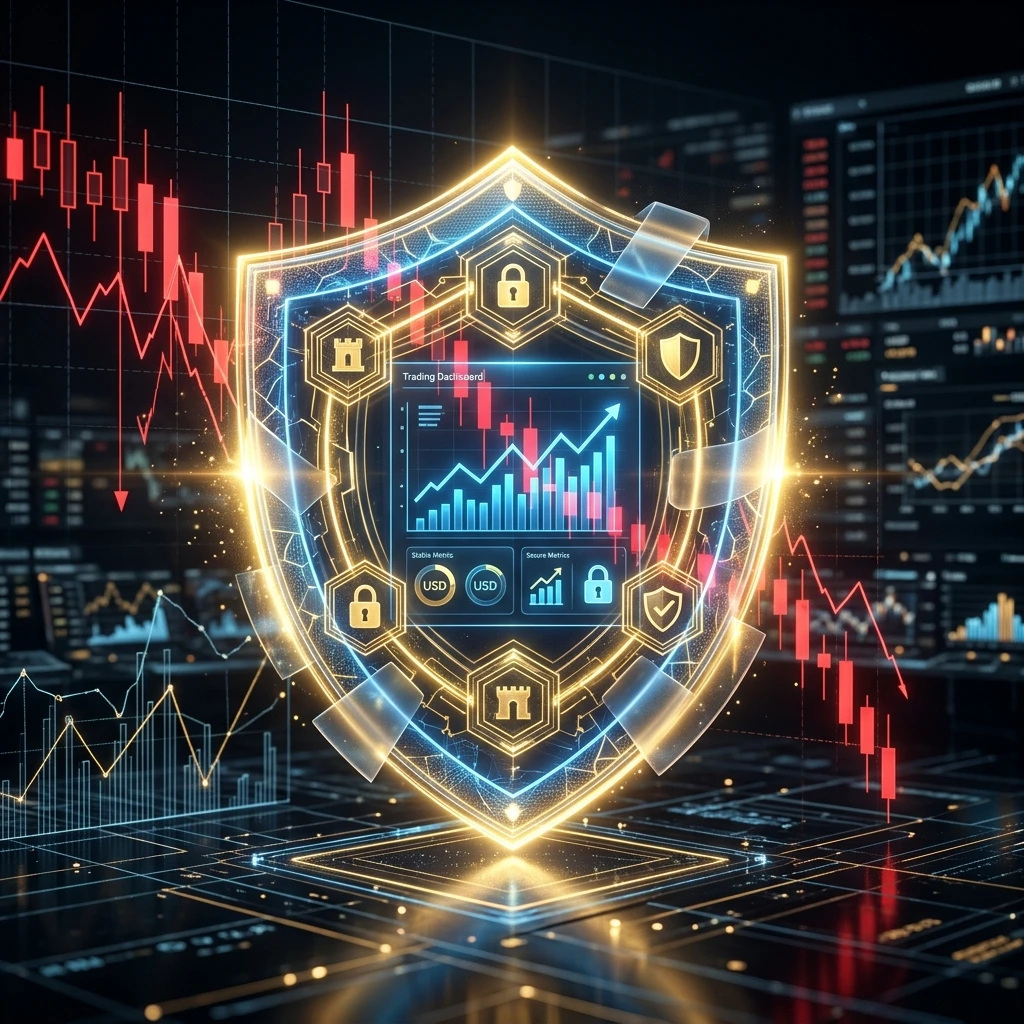
Practical guides on trading psychology, performance analytics, and prop firm strategies for serious traders.

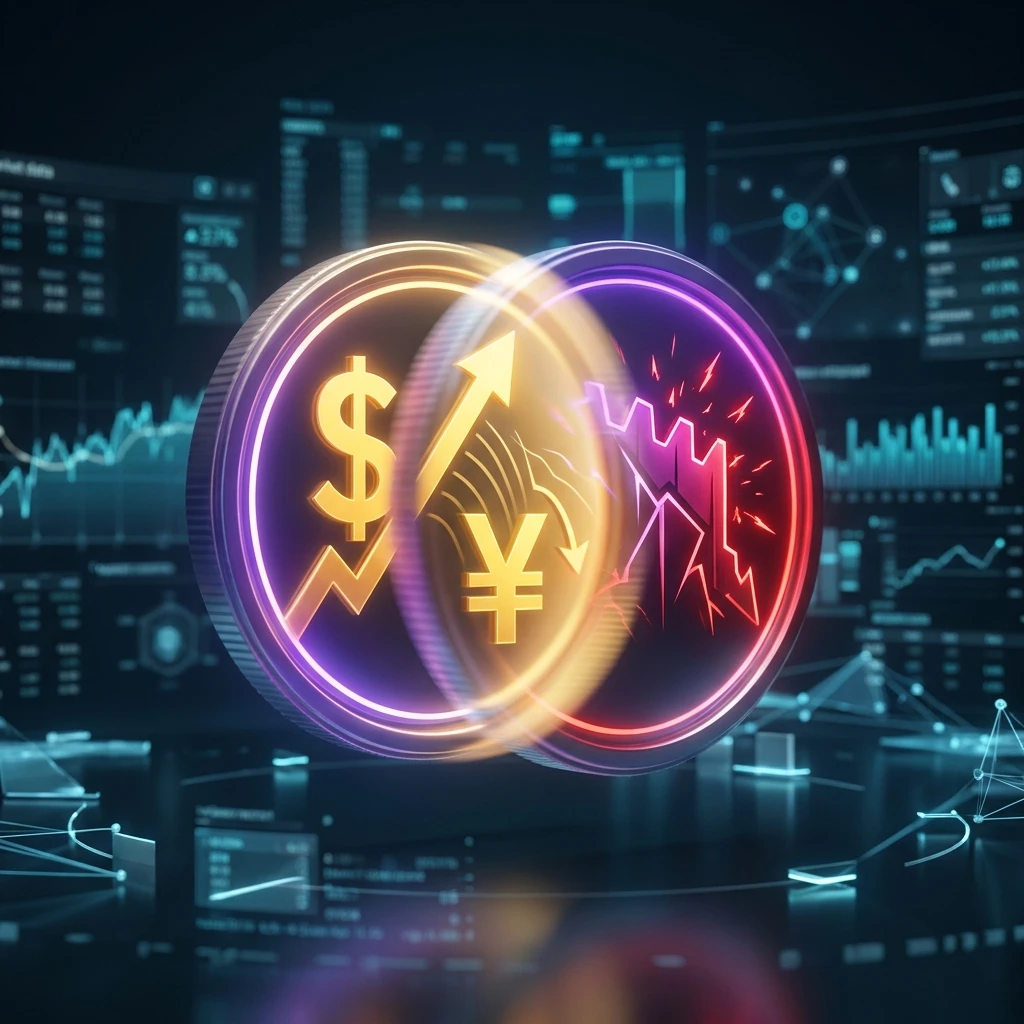
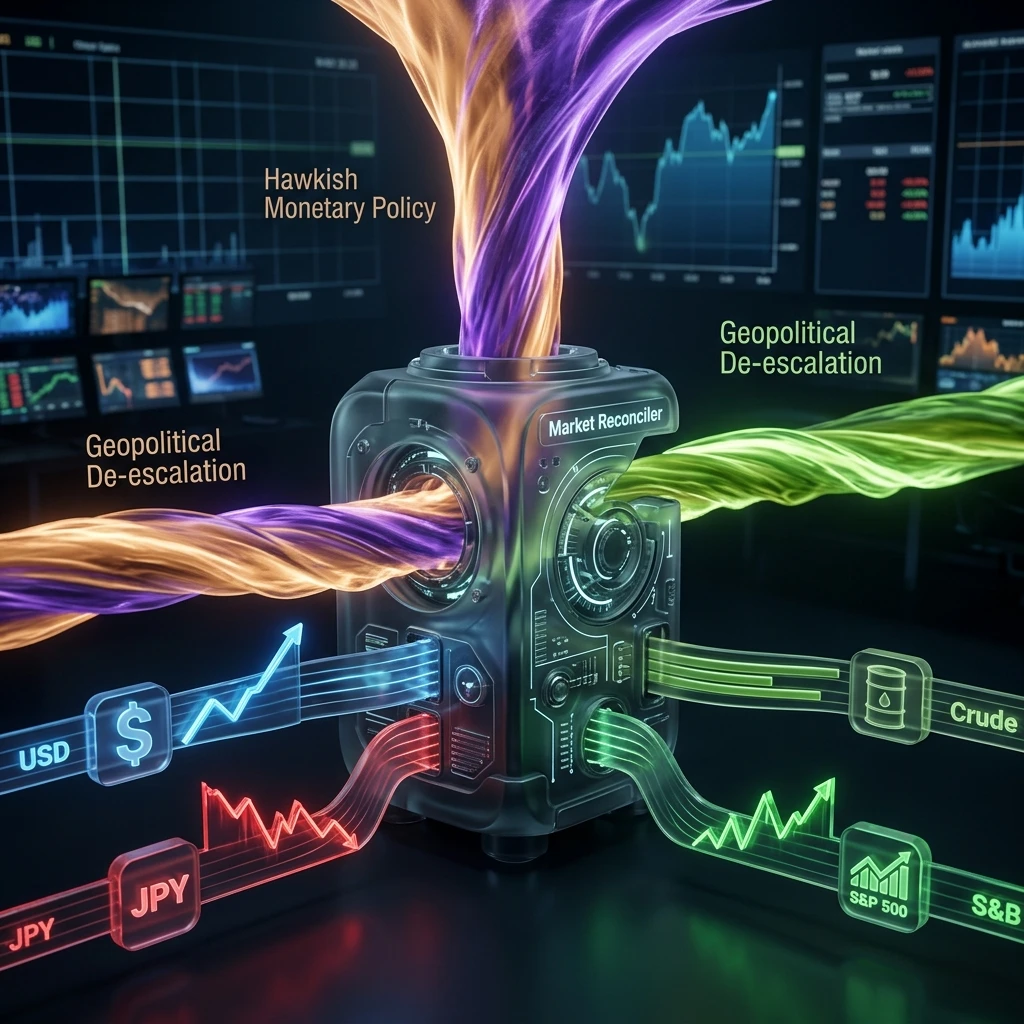
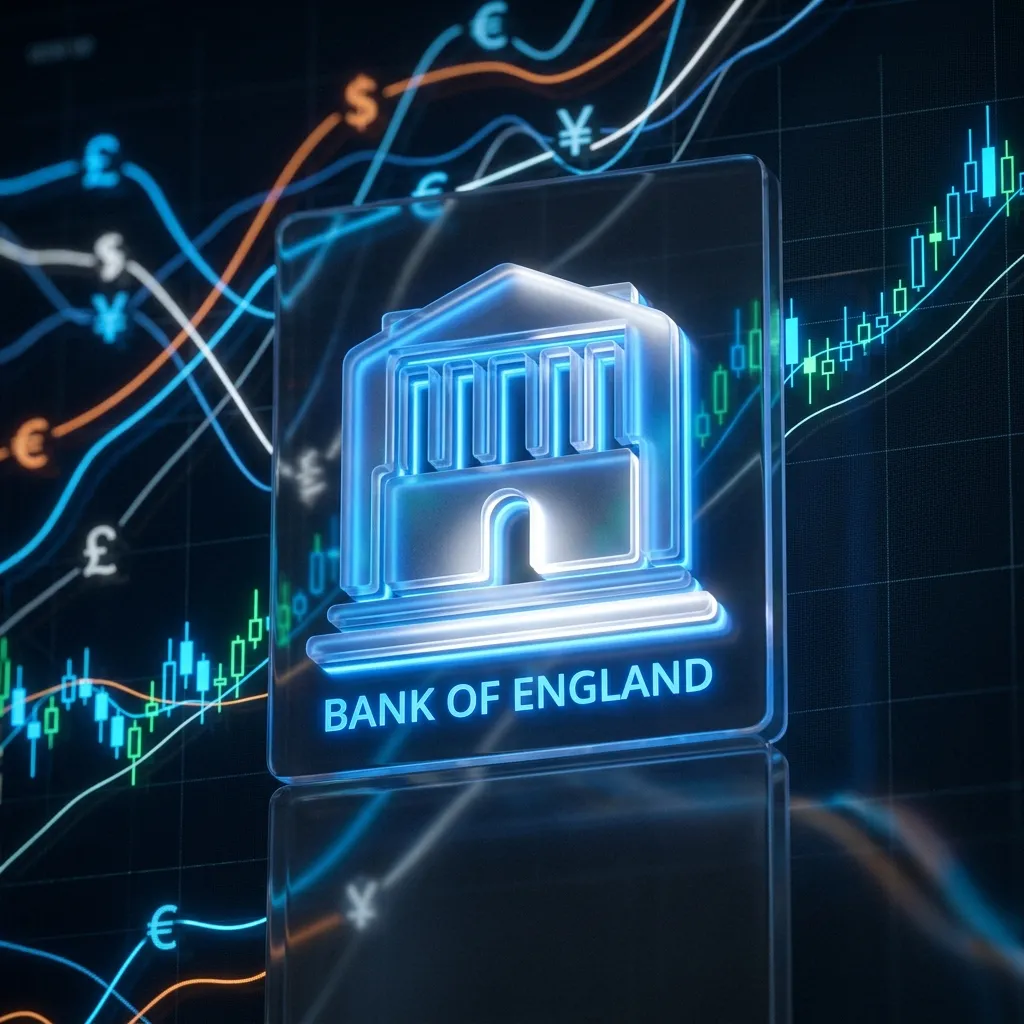
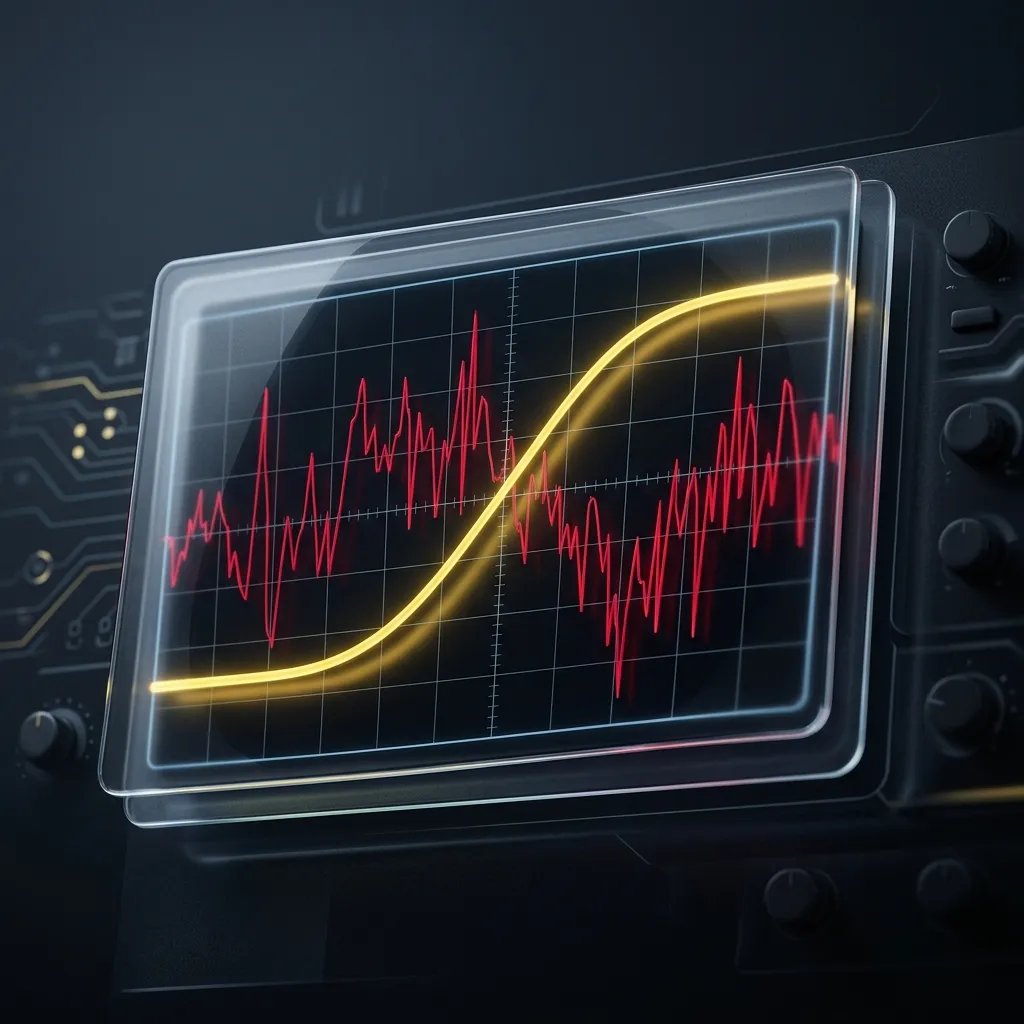
Weekly Market Recap: S&P 500 Defies Gravity, Apple's AI Pivot, and BoE Holds Steady
A comprehensive breakdown of the major macro themes that drove the markets in the third week of June, featuring the S&P 500's relentless momentum, Apple's AI infrastructure pivot, and the Bank of England's cautious hold.
Read Briefing →
Tech-flation Reality Check: Apple's Squeeze & Your AI Portfolio
Apple's price hikes expose tech's inflation vulnerability. Is your AI-driven prop firm portfolio ready for the squeeze? Re-evaluate risk and adapt to macro pressures
Read article →
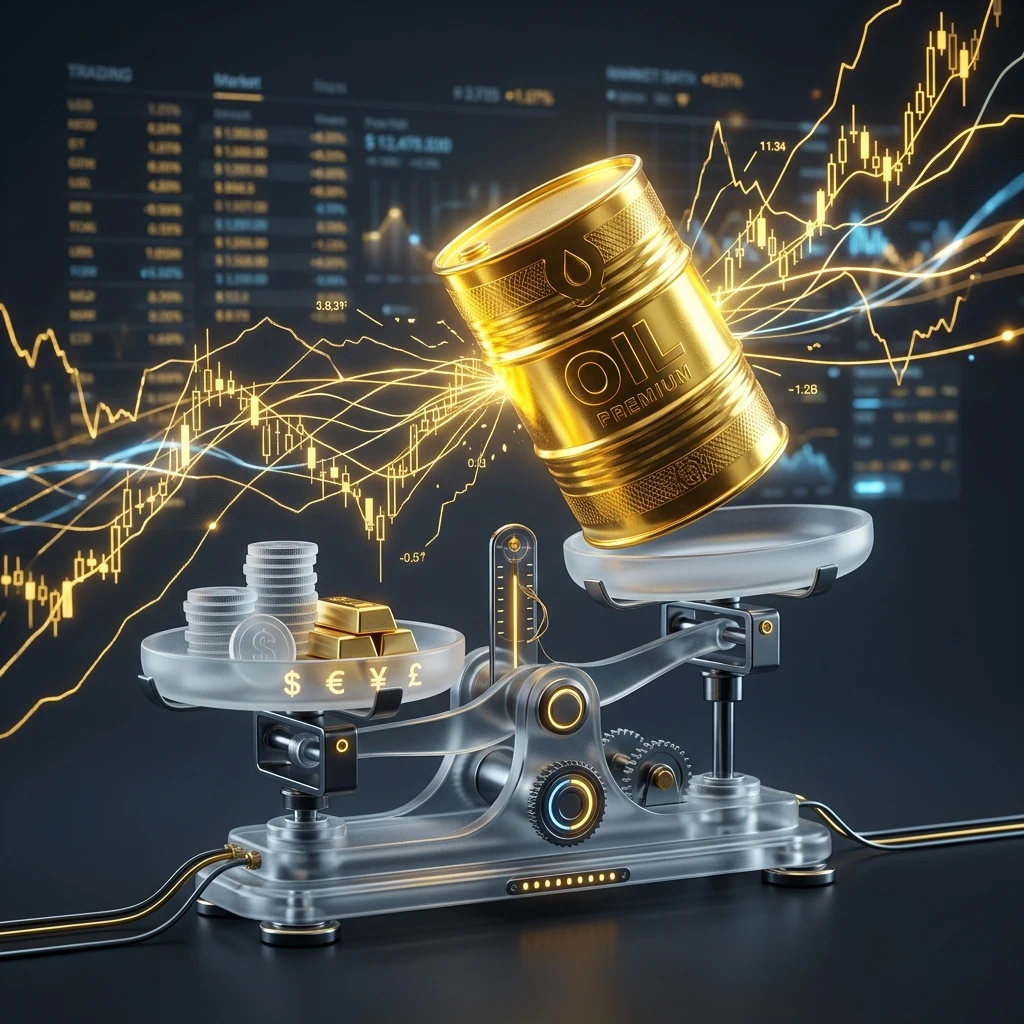
Hormuz Hazard: Trading Oil's Geopolitical Volatility Multiplier
Geopolitical flare-ups in the Strait of Hormuz aren't just adding a premium to oil; they're amplifying market dynamics. Learn how to quantify and trade this volatility mu

South Korea's 24/7 Won: Prop Firm Volatility Vortex Ahead?
Seoul's bold move to 24-hour KRW trading aims for developed market status, but for prop firm traders, it's a direct invitation to extended volatility and new risk landsca

US Hawkishness & Tech's Inflation Headache: Your Divergence Playbook
Sticky US inflation and strong GDP solidify the Fed's hawkish bias, anchoring USD. Meanwhile, tech faces an inflationary growth scare. Learn to trade this market fragment
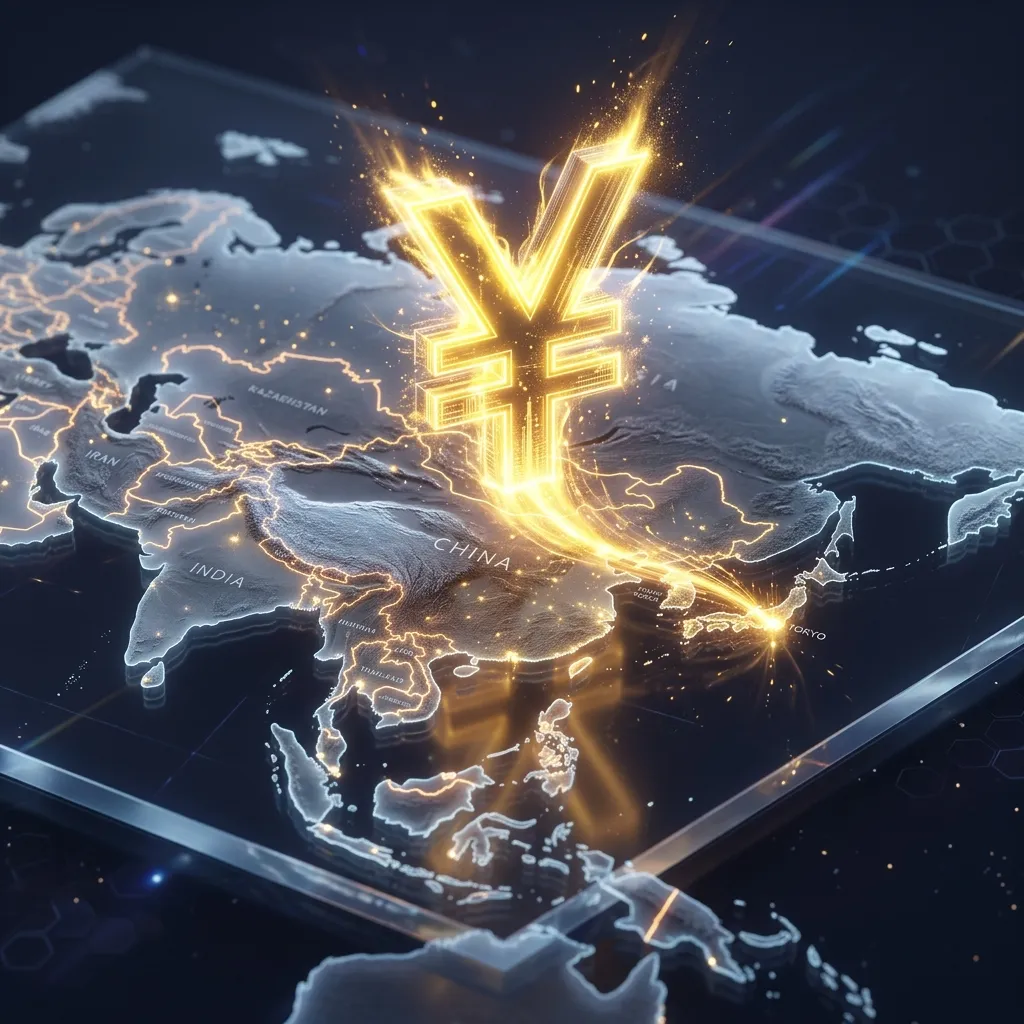
Yen Carry Trade: Navigating the Intervention Trapdoor
The USD/JPY carry trade is a siren song, but BOJ intervention lurks. Learn how prop firm traders can exploit rate differentials while dodging the sudden, costly reversals

CAD's Recession Shock: Your Divergence Playbook for North America
Canada just slipped into recession, creating a potent divergence opportunity for CAD pairs. Learn how to leverage this weakness against a surging USD and manage contagion

Fed's Iron Grip: Why Oil's Retreat Isn't True Risk-On
Geopolitical calm signals risk-on, yet gold plunges and USD soars. This isn't a simple market. Discern the Fed's overriding hand from illusion

MiCA's Final Countdown: EU Crypto Regulation & Your Trading Edge
The EU's MiCA regulation deadline is days away. This isn't just compliance; it's a seismic shift for crypto traders. Learn how to adapt your stablecoin and exchange strat

US Data & the Hawkish Fed: Your Playbook for Today's Volatility
Today's US GDP, PCE, and Jobless Claims are set to ignite markets. Learn to navigate the Fed's hawkish grip, manage risk, and capitalize on the dollar's surge or an unexp

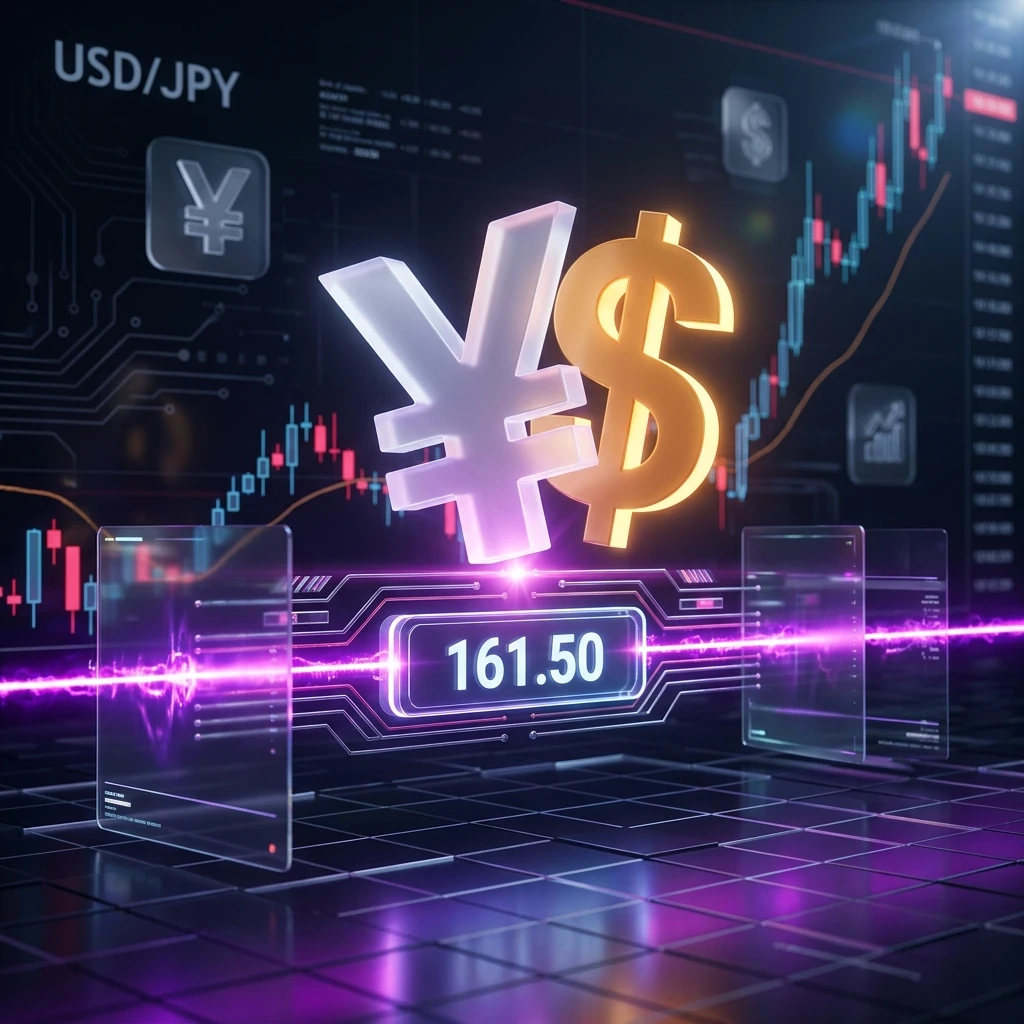
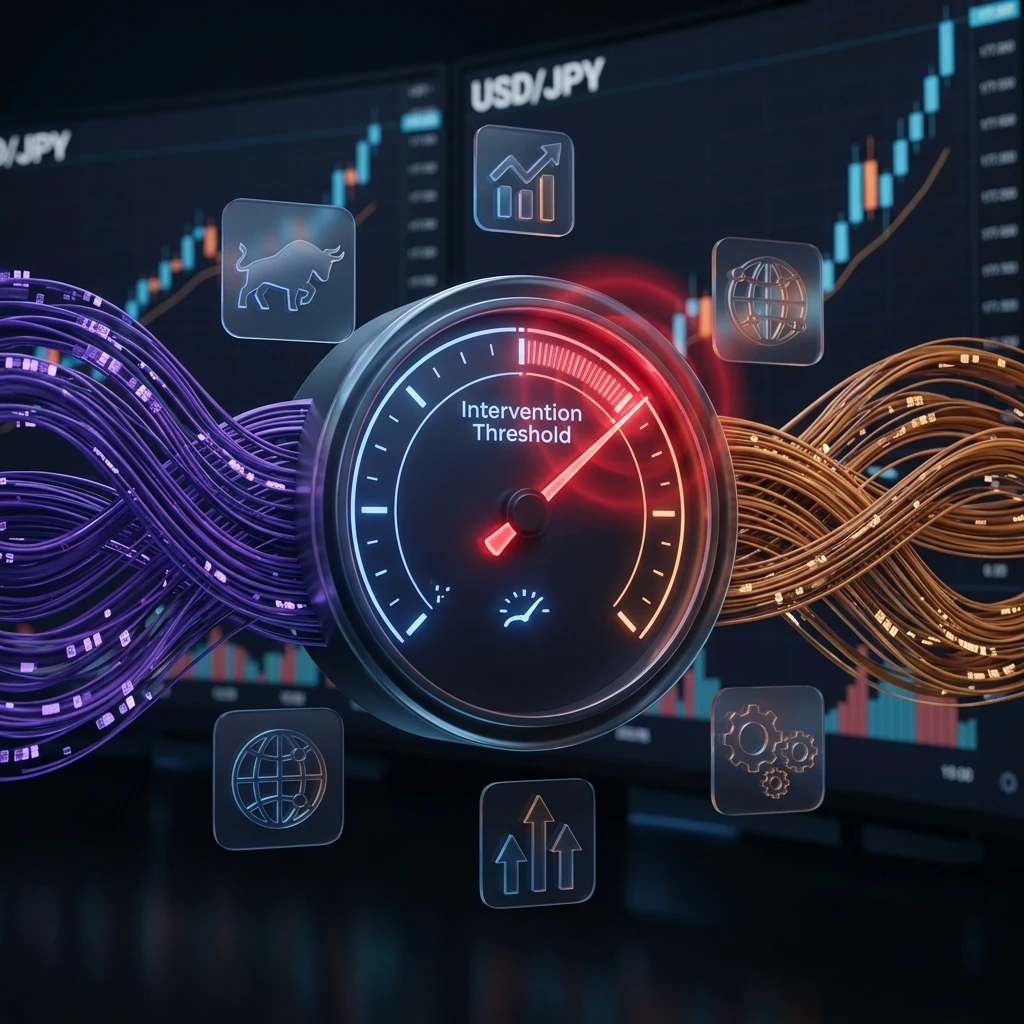
Yen's Razor Edge: Trading BOJ's AI Hopes vs. Intervention Threat
The JPY is caught between BOJ's AI optimism and a looming intervention threat at 161.50, creating a high-stakes, two-way market for prop firm traders
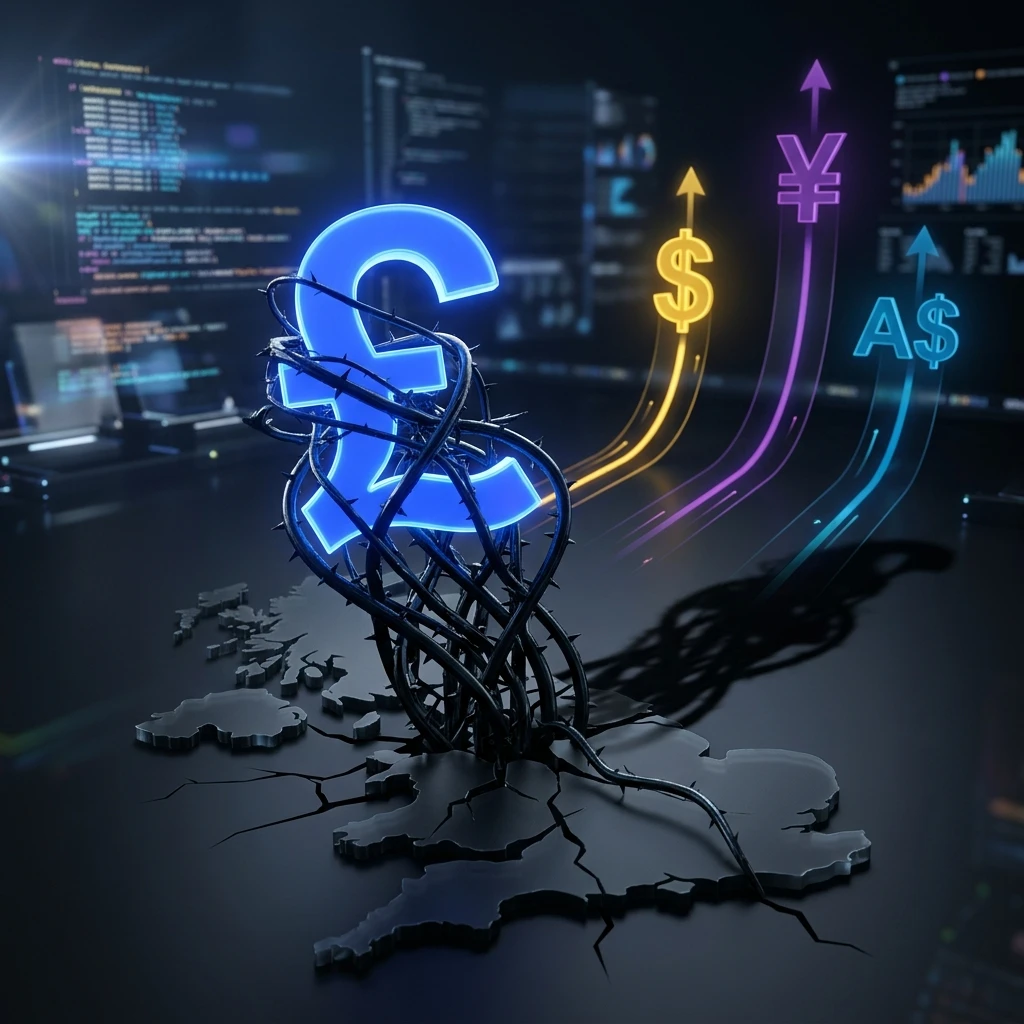
GBP's Decade of Drag: Navigating Structural Headwinds Post-Brexit
A decade post-Brexit, the UK economy faces persistent structural drag. Learn how prop traders can distinguish long-term fundamental headwinds from short-term noise to ref

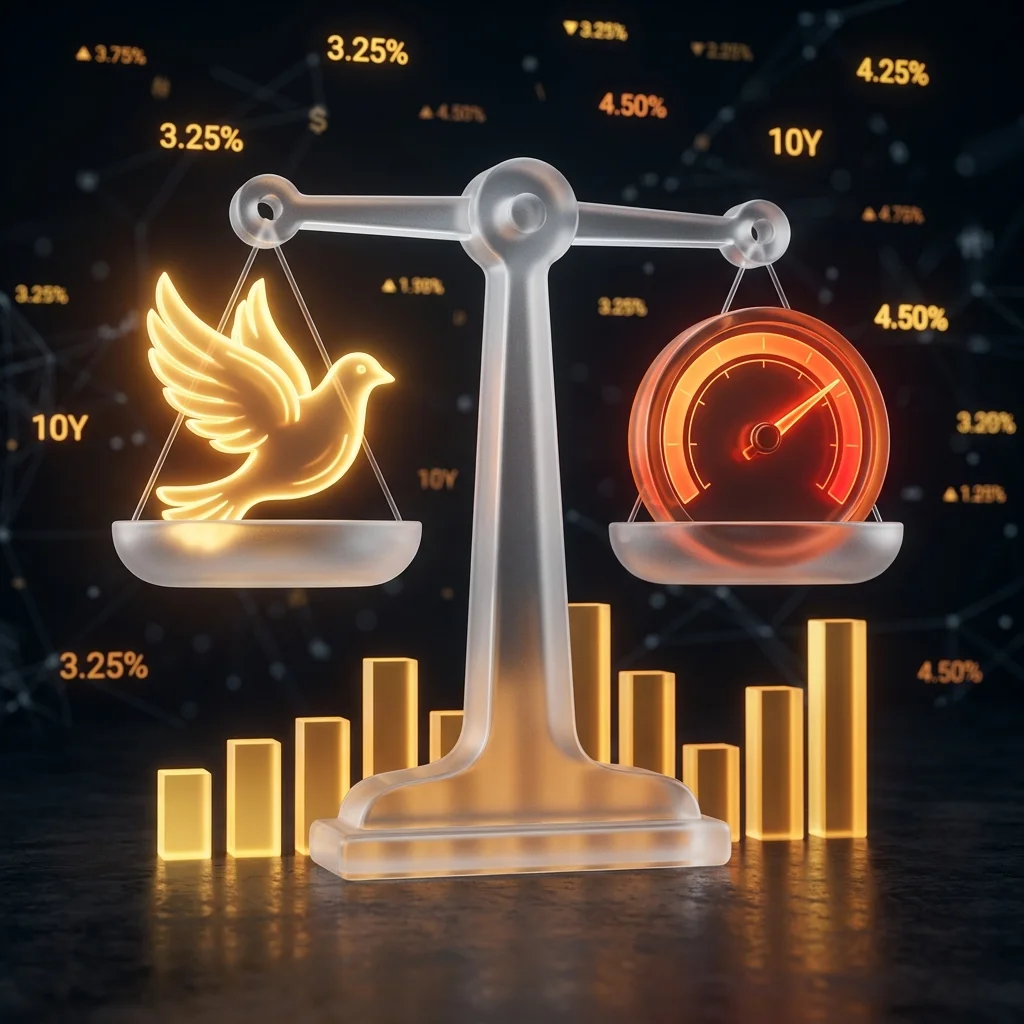
Hawkish Horizons: Trading Central Bank Divergence in Forex
The BOJ, RBA, and Fed are tightening, but their pacing creates massive forex opportunities. Learn to map the 'Hawkish Divergence Playbook' and exploit policy gaps

Inflationary Decoupling: Trading Central Bank Resolve vs. Geopolitical Calm
Oil prices drop on peace hopes, but central banks remain hawkish on sticky inflation. This divergence creates high-risk, high-reward setups for prop firm traders navigati

Micron Earnings: The AI Mirage Test for Prop Firms
Micron's Q3 report isn't just about one chipmaker; it's a critical stress test for the entire AI market rally. Learn how to dissect the data, manage exposure, and spot th

US Economy's Two Speeds: Trading the Divergence as Tech Sells Off
Manufacturing surges while tech tumbles, creating a perilous split in the US economy. Discover how prop firm traders can navigate this divergence, manage risk, and find o

Divergence Trap: Why 'Mixed Sentiment' Is Your Biggest Risk
Don't get fooled by broad market sentiment. Today's headlines reveal a 'Divergence Trap' where conflicting forces create unique risks and opportunities across equities, F

ECB vs. Fed: Trading the Policy Chasm in EUR/USD
The ECB downplays inflation while the Fed signals hikes. This divergence creates a clear directional bias for EUR/USD. Learn how to capitalize on the policy chasm without

Fed's Hawkish Anchor: Remapping USD & Bond Strategies
Goolsbee and Warsh's inflation warnings signal a fundamental shift in Fed policy. Recalibrate your prop firm strategies for a persistently hawkish dollar environment

Geopolitical Crossroads: Trading Oil & Gold's Dual Signals
The Strait of Hormuz is shut, peace talks progress. Oil and gold are caught in a whipsaw. Learn to navigate the market's conflicting geopolitical signals without blowing

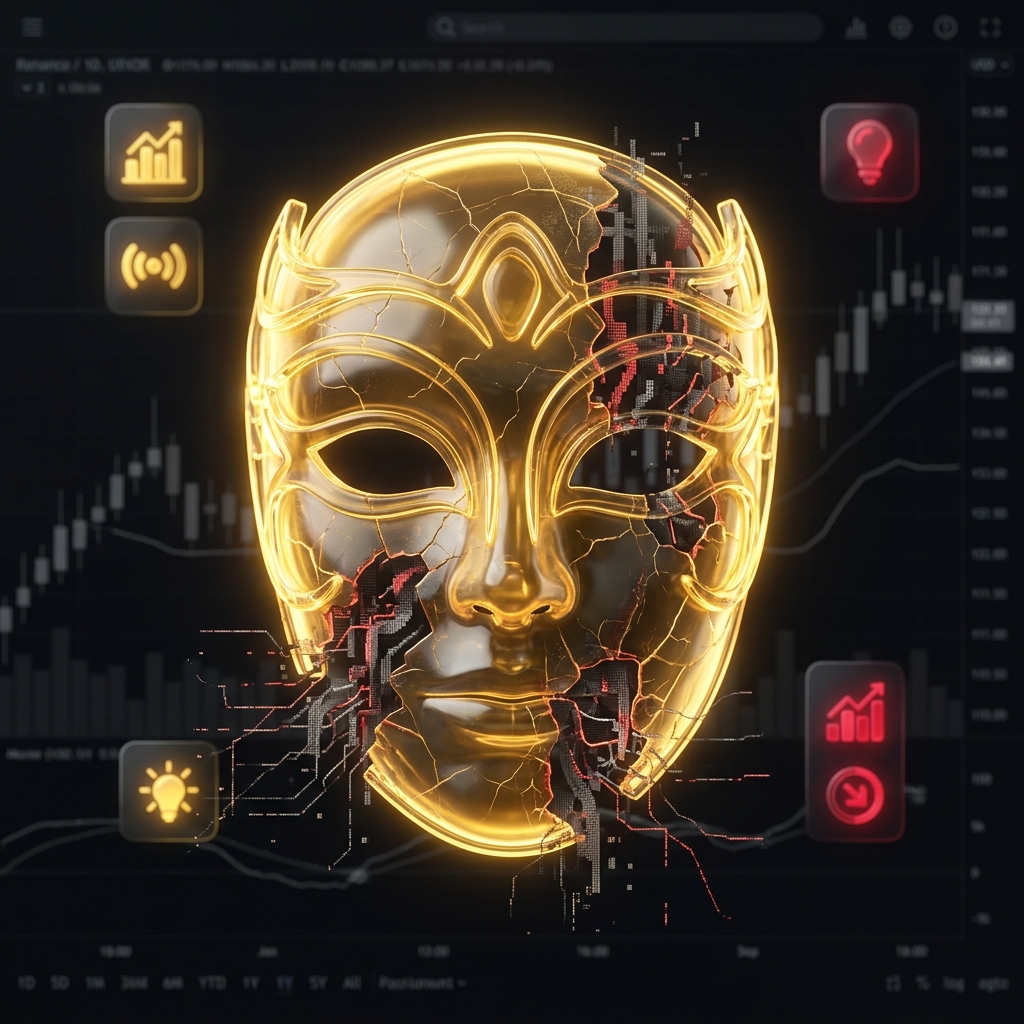
Yen's Intervention Illusion: USD/JPY's Trap for Prop Traders
The Yen hovers at a 40-year low, and intervention chatter is deafening. But is it a certainty or a psychological trap? Master the 'Intervention Zone Defense'

AI's Concentrated Power: Prop Firm Risk in a Rebalanced Nasdaq
The Nasdaq-100's shift towards AI infrastructure is creating unprecedented opportunities but also insidious concentration risks. Learn how to protect your prop firm capit

The Divergence Paradox: Trading Prop Firms in a Fragmented Market
Geopolitical shocks, hawkish central banks, and an AI boom are ripping markets apart. Learn how to identify high-conviction trades and manage risk when correlations fail

Strait of Hormuz: Your Prop Firm's Defensive Playbook
US-Iran tensions just closed the Strait of Hormuz. Oil prices are soaring, global risk aversion is spiking. Here’s how prop firm traders pivot to defense and capitalize o

Fed's New Game: Trading the "Mixed Signals" Trap
US-Iran peace talks spark risk-on, but hawkish central banks and rising inflation loom. New Fed Chair Warsh adds unpredictability. Learn to avoid the 'Mixed Signals Trap'

Warsh's Fed: Navigating USD's Uncharted Volatility
The new Fed era under Kevin Warsh signals less predictable policy. Prop firm traders must adapt to data-driven USD moves, sharpening analytics and risk management

AI Bubble & Macro: The Leveraged Divergence Trap
While AI fuels a tech rally, hawkish central banks and oil shocks are setting a dangerous trap for S&P 500 and Nasdaq. Understand the risks and protect your prop firm cap

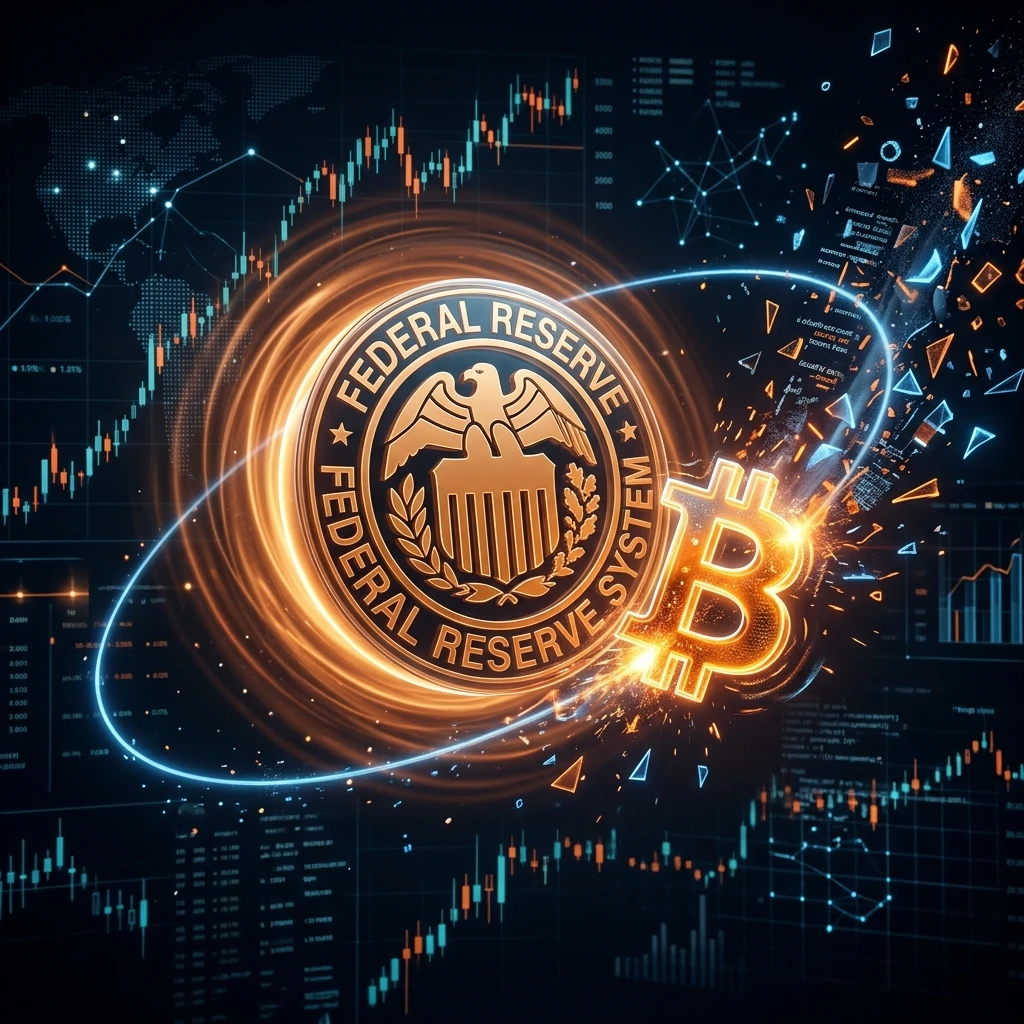
Bitcoin's Macro Tether: Trading BTC in a Hawkish Fed World
Forget crypto isolation. Today's market proves Bitcoin's fate is tied to the Fed and the dollar. Learn to navigate BTC's new reality and protect your prop firm capital
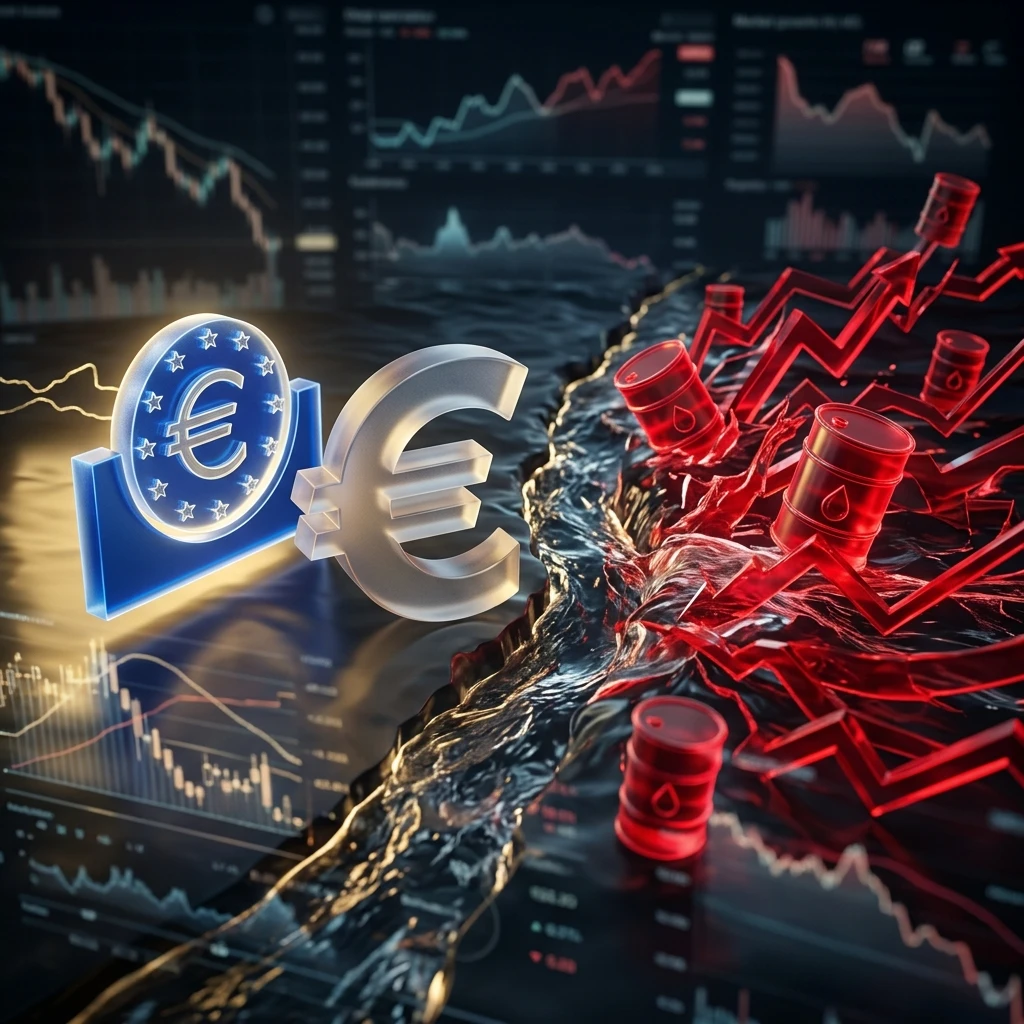
ECB's Inflationary Strait: Trading Euro Volatility Post-Hike
The ECB just hiked rates, but it's not a simple bullish signal. Understand the complex forces driving Euro volatility and how to navigate this tricky landscape

Hawkish Tides & Bond Breakers: Prop Firm's Defensive Playbook
Rising bond yields are flashing red. With hawkish central banks and oil surging, your prop firm portfolio needs a defensive pivot. Learn how to navigate this fractured ma
Yen at 40-Year Lows: Trading the BOJ's Intervention Trigger Zone
USD/JPY is a powder keg. With the Yen at multi-decade lows and BOJ intervention imminent, prop traders need a game plan for extreme volatility. Don't get caught flat-foot

Hawkish Fed & Crypto: The Bond Market's Bitcoin Warning
The yield curve is flashing red for crypto. A hawkish Fed is repricing risk, forcing a critical look at non-yielding assets. Here's how to navigate this potential decoupl
Hawkish Harmony Meets Peace Dividend: Prop Firm Plays in a Fractured Market
Central banks are hawkish, but a major peace deal just dropped. This creates a 'Dual-Force Delta' in forex and equities. Learn how to navigate these conflicting signals a

JPY Intervention: Navigating the 40-Year Low Crossroads
Japan's Yen is at a 40-year low, triggering intervention threats and inflation risks. For prop firm traders, this is a volatile crossroads demanding precision, strategy,
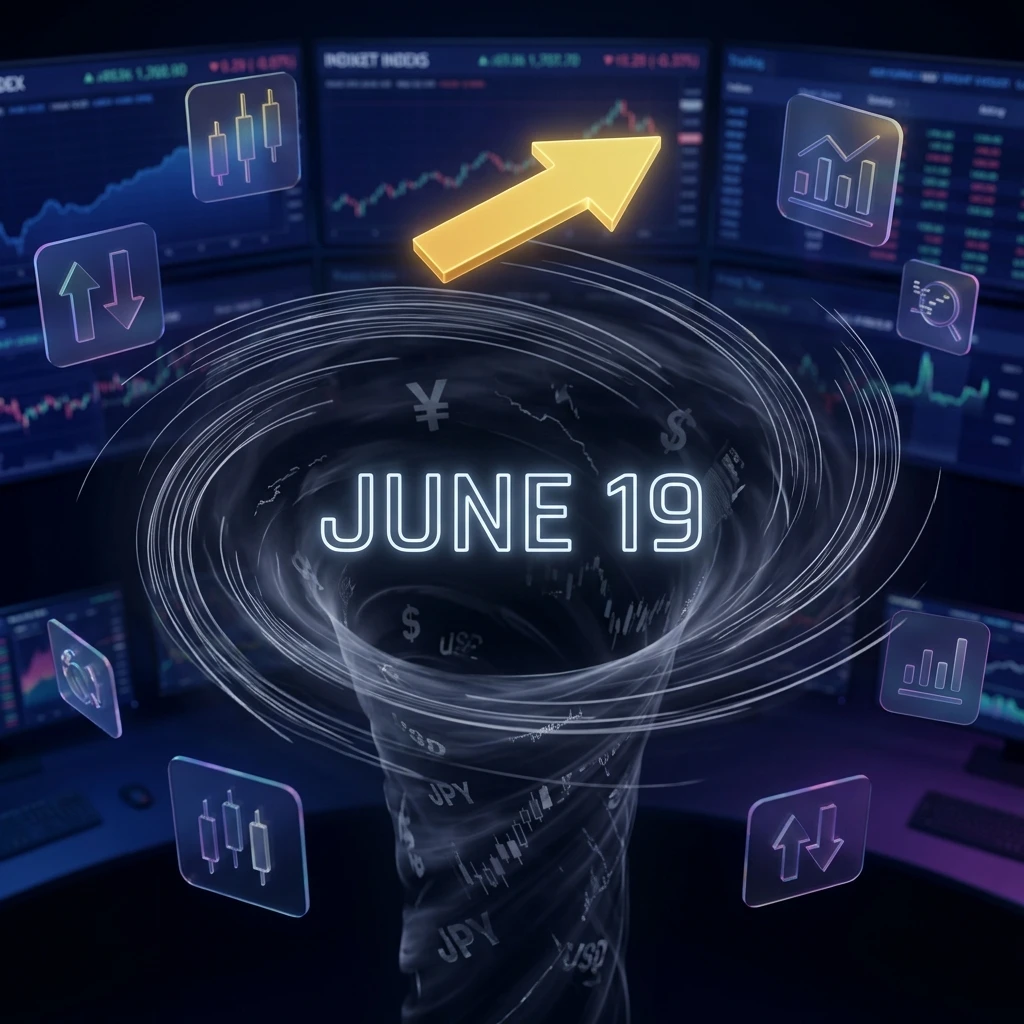
Juneteenth Liquidity Vacuum: Master Post-Witching Gaps
Today's US market holiday and options expiry aftershocks create a unique liquidity landscape. Learn to navigate wider spreads, gamma traps, and profit from the chaos

Peace Dividend Paradox: Navigating Mixed Market Signals
The US-Iran peace deal sparked euphoria, but hawkish central banks and holiday liquidity gaps create a complex trading landscape. Learn to spot the real signals

CHF's Invisible Ceiling: Trading SNB's Intervention Horizon
In a mixed market, the Swiss National Bank offers a rare predictable anchor. Learn how to leverage the SNB's intervention threat to find high-probability counter-trend op
Crypto's Fed Headwind: Navigating Prop Firm Risk
Bitcoin's latest dip below $64k isn't just noise; it's a stark reminder that traditional macro forces, especially the Fed, are reshaping digital asset risk appetite

Geopolitical Pivot: Trading the Risk Premium Unwind
The US-Iran peace deal reshapes global risk. Learn to capitalize on lower oil and shifting safe-haven flows, while navigating Fed hawkishness and JPY intervention threats
Warsh's Hawkish Fed: Recalibrating Prop Firm Risk in a Triple-Divergence Market
The Fed's unexpected hawkish shift, coupled with mixed global signals, demands a new playbook. Discover how to re-evaluate your risk models and capitalize on emerging div
Yen's Edge: Trading USD/JPY's Intervention Threshold
The Yen is testing BOJ's patience. With USD/JPY at multi-year highs despite a rate hike, prop firm traders need a framework to navigate potential intervention. Don't get

Asia's Uneven Peace Dividend: Trading the Lingering Scars
The US-Iran peace deal sparked global euphoria, but don't mistake broad market relief for a uniform recovery in Asia. We dissect why regional economies face persistent he

China's Stall: The Hidden Trap for AUD/USD & Commodities
Geopolitical calm masks a deeper threat to commodity-linked assets. Learn why China's economic struggle demands a tactical shift in your AUD/USD trades

Fed's Warsh on the Tightrope: Navigating USD & Equity Volatility
New Fed Chair Kevin Warsh faces an inflation test, creating a high-stakes environment for USD and equities. Learn how prop firm traders can capitalize on inevitable volat

Oil's Peace Premium Illusion: Trading the Geopolitical Reversion
The market bought the peace headline, sending oil plummeting. But the Hormuz reality check and Iran war scars persist. Here's how prop firm traders can trade the inevitab

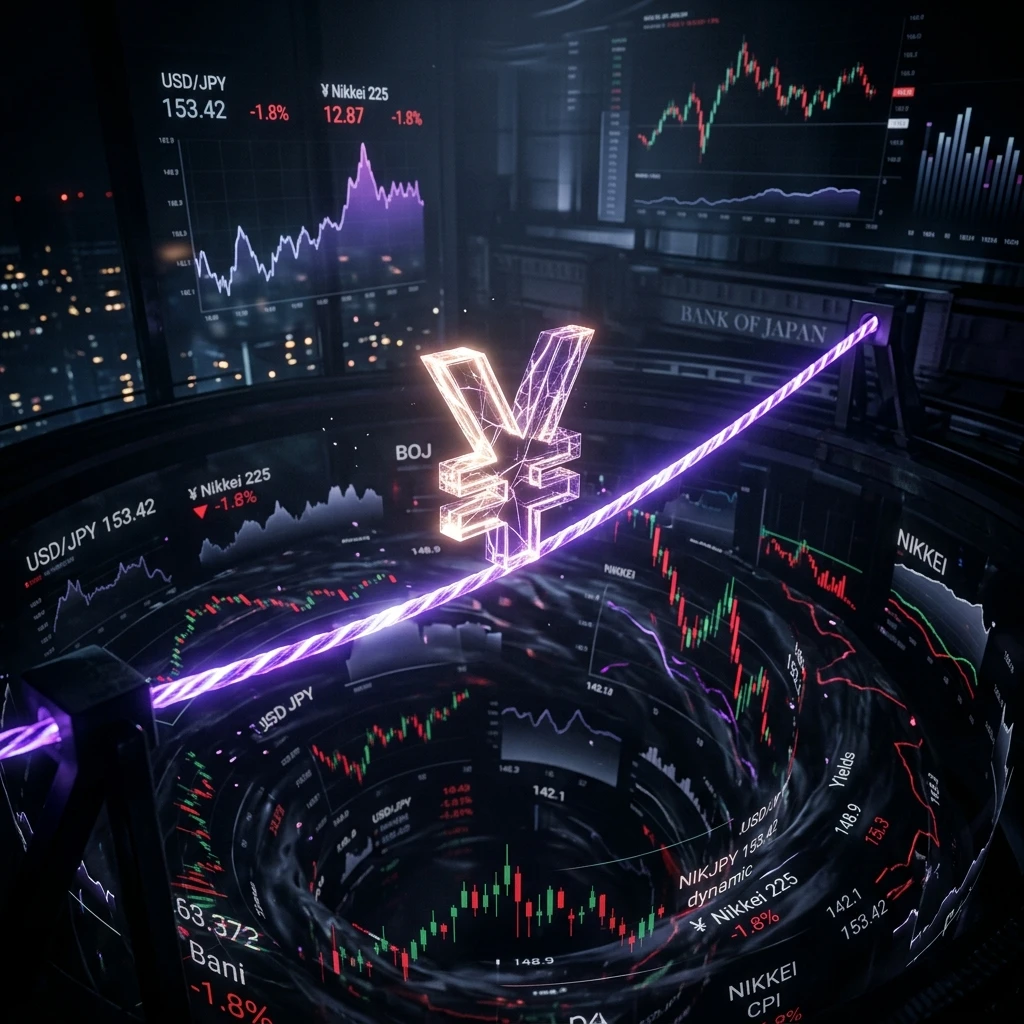
USD/JPY: Why Japan's Yen is a Trader's Divergence Play
Despite a BOJ hike, the Yen continues its slide. Japan's trade deficit is widening, creating a compelling divergence trade against the USD. Learn how to navigate interven

BOJ's Historic Rate Hike: Will the Yen Break Free from Ultra-Loose Policy?
The Bank of Japan has officially raised its benchmark interest rate to 1%, marking its highest policy rate since 1995. Here is the prop firm playbook for trading JPY.

Geopolitical Peace, Monetary War: Navigating Divergent Currents
The US-Iran peace deal sparked a risk-on rally, but don't let the headlines fool you. BOJ's aggressive hike and China's woes signal a market of divergent currents. Adapt

JPY Reversal, Tech Surge: Deciphering Today's Divergence
Geopolitical calm, tech euphoria, and BOJ tightening create a complex market. Master the art of divergence trading and liquidity recalibration

Navigating the Great Divergence: Your Prop Firm Playbook
Markets are pulling in every direction today, from geopolitical peace to central bank tightening and tech euphoria. Forget simple narratives; here's how to profit from th

Peace Dividend Paradox: Why Today's Rally Demands Prop Firm Agility
A US-Iran deal ignited a risk-on rally, plunging oil and easing inflation fears. But don't mistake temporary relief for a permanent trend. Here’s how prop firm traders sh

AI's Leverage Horizon: Trading Nvidia's Debt-Fueled Innovation
Nvidia's $20B bond issuance signals a shift: AI's explosive growth is now fueled by massive debt. Prop firm traders must understand the new risks and opportunities this c

AUD's Canary in the Coal Mine: The Commodity Currency Conundrum
Global sentiment swings, but the RBA's pause and China's slowdown paint a stark picture for the AUD. Discover the Commodity Currency Conundrum and how to position for pot

ECB's Hawkish Echo: Why Peace Won't Kill Eurozone Inflation
The US-Iran peace deal crashed oil, yet the ECB hiked. This signals sticky inflation beyond geopolitics, forcing traders to rethink Eurozone rate bets and risk exposure
Euphoria's Veil: Don't Trade the Headline, Trade the Reality
Global markets are celebrating peace, but hidden US economic cracks demand discipline. Learn to spot the disconnect and protect your prop firm capital

Peace Premium Trap: Don't Over-Leverage Hormuz Euphoria
The US-Iran peace deal sparked a global rally, but beneath the surface, macro headwinds and policy dilemmas lurk. Learn to navigate this 'peace premium' without falling i
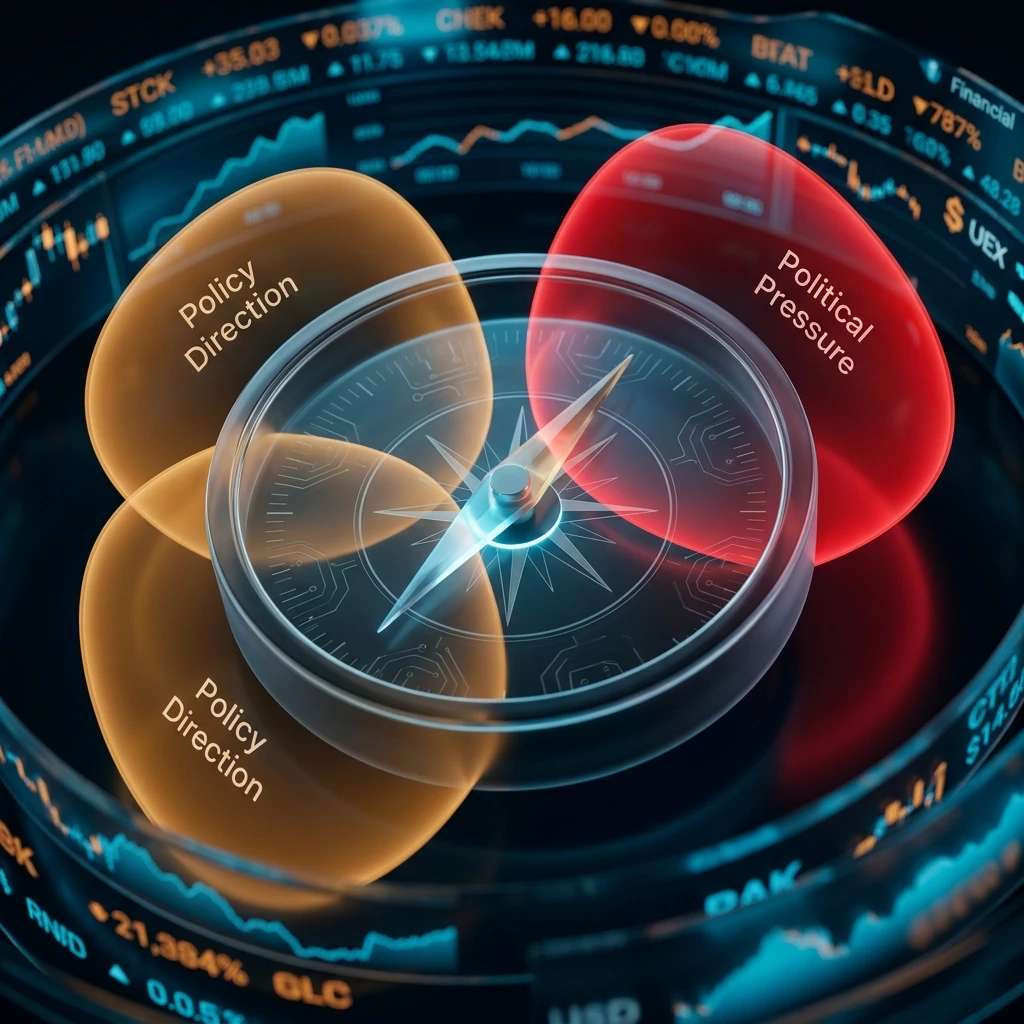
Warsh's Crucible: Trading the Fed's Political-Monetary Tightrope
New Fed Chair Kevin Warsh faces a high-stakes test, balancing inflation and political pressure. This isn't just a rate decision; it's a credibility battle with profound i

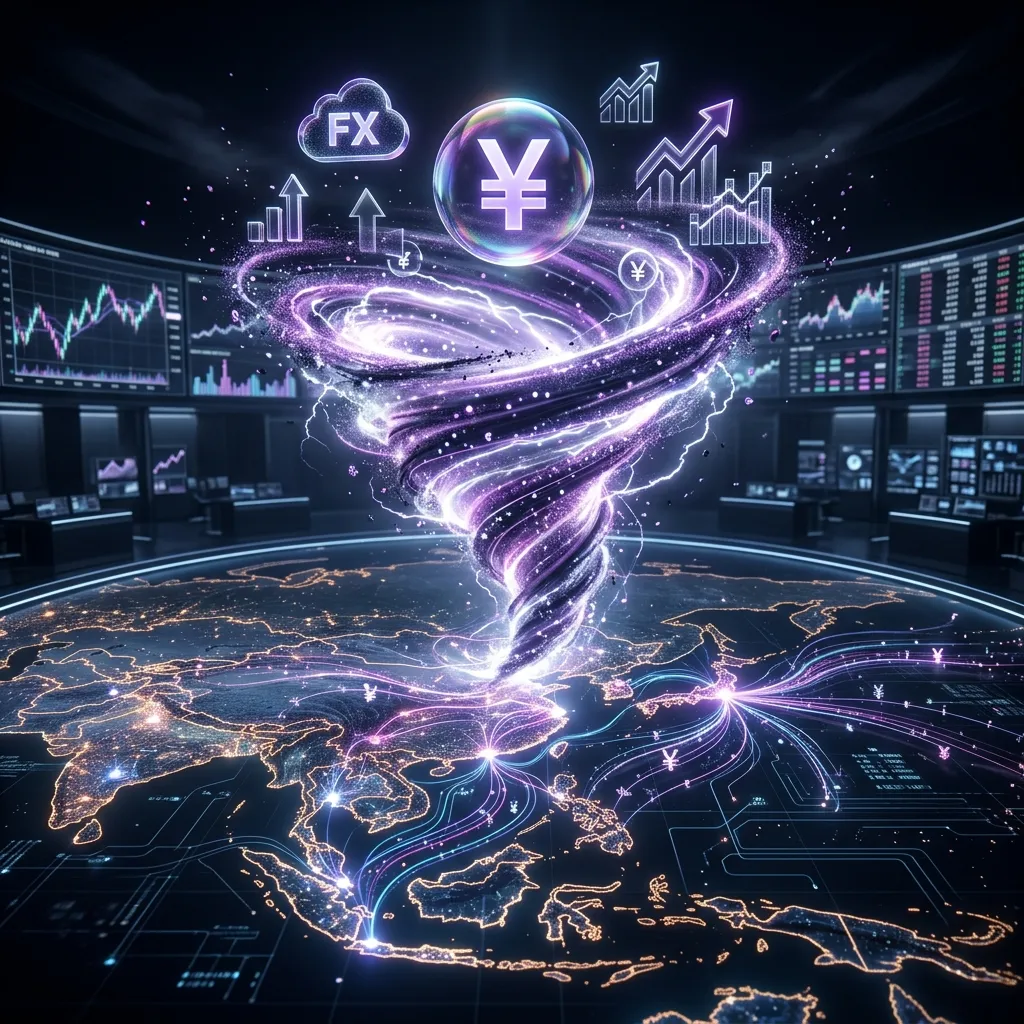
The Great Yen Unwind: Navigating BOJ's Paradigm Shift
Japan's rate hike shatters decades of carry trade dogma. Prop firm traders must adapt or face the brutal unwinding of long-held JPY shorts

Beyond the Headlines: Decoding Central Bank Nuances from the ECB, BoJ, and RBA for Strategic Forex Positioning
With the ECB already hiking, the BoJ poised to raise to 1%, and the RBA holding — but not ruling out future moves — prop firm traders face a landscape of global monetary policy divergence. The opportunity isn't just in knowing the decisions; it's in reading the nuanced forward guidance between the lines.

The Iran Peace Dividend: How Falling Oil Prices Reshape Forex Strategies and Inflation Bets
A US-Iran peace deal expected to be signed Sunday could reopen the Strait of Hormuz and permanently shift the global energy supply outlook. For prop firm traders, the cascading effects — lower oil, reduced inflation pressure, revised central bank paths — create a major repositioning opportunity across forex, commodities, and indices.

The 'Musk Effect' and Crypto's Crossroads: Analyzing the Impact of SpaceX's Blockbuster IPO on Digital Asset Flows and Market Sentiment
SpaceX's $2 trillion Nasdaq debut created the largest capital reallocation event in recent memory — and crypto bore the brunt. With Bitcoin below $65,000 and ETFs posting 13 consecutive days of outflows totaling $4.3 billion, prop firm traders face a complex setup where institutional approval and actual market behavior sharply diverge.

The Shifting Sands of Crypto: How ETF Approvals Clash with Outflow Trends and Macro Headwinds for Retail Traders
The SEC's approval of an active multi-asset crypto ETF (BTC, ETH, XRP) is a landmark institutional milestone — yet Bitcoin is struggling below $65,000 with relentless ETF outflows. This divergence between institutional architecture and actual capital behavior is a critical lesson for retail prop firm traders.

USD/JPY's Unyielding Strength: Why the Yen Can't Catch a Break and How to Trade Potential Intervention
USD/JPY is pinned near 160 — a level that historically triggers Japanese authorities to act. With the BoJ's June rate hike expected and Governor Ueda absent from the press conference, the communication risk is enormous. For prop firm traders, this setup requires a precise playbook for navigating intervention risk.

The ECB's Rate Hike: A New Tightening Cycle or a One-Off Response to Geopolitical Inflation?
The ECB's landmark 25bps hike — its first since 2023 — raises the defining question for EUR traders: is this the beginning of a sustained tightening cycle, or a reactive move to the Middle East energy shock? The answer has dramatically different implications for EUR/USD, European bonds, and every EUR cross on your watchlist.

SpaceX IPO: Navigating the Hype and Valuation in a Concentrated Tech Market
SpaceX's $75 billion raise and $1.77 trillion debut valuation is the largest IPO in US market history. For prop firm traders, this isn't just a spectacle — it's a capital reallocation event that reshapes liquidity, sector rotations, and risk appetite across tech indices, crypto, and beyond for weeks ahead.

Trump's Iran Peace Deal: How Geopolitical Shifts are Reshaping Safe-Haven Flows and Equity Markets
Trump's announcement of an imminent US-Iran peace deal sent equity markets surging and crude oil plunging — a textbook 'risk-on' shock. But prop firm traders who've survived geopolitical trading know the most dangerous moment is when the market is this euphoric. Here is how to navigate the peace trade without getting caught in the reversal.

UK Inflation Expectations Soar: How the Iran War is Forcing the BOE's Hand and What it Means for GBP Traders
Bank of England surveys reveal Britons expect inflation to double the BOE's target — a significant signal that the UK's central bank faces mounting pressure to act. Simultaneously, the UK economy contracted in April. For GBP traders, this stagflationary crossroads creates high-volatility opportunities.

US Inflation and Jobs Data: The Fed's Dilemma and its Impact on Dollar Strength
CPI at 4.2%, PPI at 6.5% year-over-year, and NFP more than doubling expectations at 172,000 — three simultaneous data beats that create an undeniable Fed dilemma heading into the June 16-17 FOMC. For prop firm traders, this trifecta redefines the dollar outlook and every USD pair trade for the next month.
BOJ Uncertainty and Asian Currency Wars: Unpacking the Implications of Ueda's Illness and Regional FX Pressures
BOJ Governor Ueda's illness adds an unprecedented communication risk to an already complex Asian FX landscape. With regional currencies under pressure from dollar strength and energy price inflation, prop firm traders must navigate a multi-dimensional setup where the wrong interpretation of BOJ signals can be extremely costly.

The ECB's Hawkish Pivot: Navigating Euro Volatility Post-Rate Hike and Lagarde's Forward Guidance
The ECB delivered its first rate hike since 2023 yesterday — now the real analysis begins. Prop firm traders must decode Lagarde's forward guidance, understand what the updated projections mean for EUR pairs, and position for the next leg of the Euro's journey in a market still digesting the shock.

Middle East Tensions and Oil: Navigating Geopolitical Risk in Your Trading Strategy
The escalating US-Iran conflict and its direct impact on oil prices introduce significant geopolitical risk that permeates every asset class. Prop firm traders must build a systematic framework for incorporating geopolitical risk into their trading strategy — not just reacting to it, but anticipating its second and third-order effects.

Oracle's AI Bet Backfires: A Warning Sign for Tech Sector Valuations?
Oracle's substantial stock drop following its AI investment announcements and debt plans highlights the market's growing sensitivity to tech valuation and AI spending sustainability. Prop firm traders with Nasdaq and tech index exposure need to understand this signal — and what it means for the broader AI narrative driving markets.

US Inflation's Stubborn Grip: How Today's PPI and Yesterday's CPI Reshape Fed Expectations and Dollar Strength
US inflation is proving more resilient than models predicted. With CPI at 4.2% and PPI expected to print hot, the Federal Reserve faces a genuine dilemma heading into June 16-17. For prop firm traders, this isn't just background noise — it's the fundamental driver of every USD trade for the next month.
AI's Earnings Power Play: How Oracle's Report and Chip Sector Strength Are Shaping Tech Index Volatility
Oracle's earnings report and the chip sector's AI-driven strength are creating a bifurcated tech market. For prop firm traders with Nasdaq and S&P 500 exposure, understanding which parts of tech are leading, lagging, and at risk of correction is the difference between profits and painful drawdowns.

The Great Central Bank Divergence: Trading Opportunities as the ECB and BOJ Tighten While the Fed Holds Steady
When major central banks move in different directions simultaneously, it creates some of the clearest and highest-conviction forex opportunities in the market. The current ECB-BOJ tightening vs. Fed holding dynamic is exactly this scenario — and prop firm traders need a precise playbook to capture it.

CPI Day Reckoning: Why Today's US Inflation Data is a Make-or-Break Moment for Fed Policy and Dollar Direction
Today's US CPI release is the single most important data point of the month for prop firm traders. Here is a complete breakdown of the scenarios, asset reactions, and risk management strategies you need to navigate this make-or-break moment for the dollar and interest rate expectations.

The Euro's Tightrope Walk: Navigating Divergent Growth and a Hawkish ECB in a Dollar-Dominated Market
The Euro faces a complex balancing act: a freshly hawkish ECB on one side, and deteriorating Eurozone growth on the other. This divergence between monetary policy and economic reality creates a high-volatility, mean-reverting environment for EUR pairs that demands a precise prop firm trading framework.

Navigating the Geopolitical Minefield: How Middle East Tensions Are Reshaping Forex and Commodity Strategies
With the US-Iran conflict continuing to dominate market narratives, prop firm traders face a complex landscape where geopolitical risk directly impacts oil prices, safe-haven flows, and every major forex pair. Here's the complete framework for trading through the minefield.
BOJ's Hawkish Pivot: Unpacking the Yen's Reaction and Trading Implications for USD/JPY
The anticipated Bank of Japan rate hike to 1% is a significant monetary policy shift. This deep-dive provides prop firm traders with an in-depth analysis of how the Yen is likely to move and what the optimal entry and exit strategies are for USD/JPY and JPY cross pairs.

Crypto's 'Extreme Fear' and the $32M Hack: Risk Management Imperatives for Digital Asset Traders
With Bitcoin struggling under heavy ETF outflows and a major altcoin hack sending shockwaves through the market, the crypto Fear & Greed Index is flashing 'Extreme Fear.' For prop firm traders with digital asset exposure, this environment demands a fundamentally different risk management approach.

Navigating the ECB's Imminent Rate Hike: How Prop Firm Traders Can Position for Euro Volatility Post-June 11
The near-certain ECB rate hike on June 11, driven by inflation and geopolitical energy shocks, presents a clear catalyst for EUR pairs. Prop firm traders must analyze the ECB's forward guidance and new macroeconomic projections to anticipate sustained Euro strength or a 'buy the rumor, sell the news' reaction.

Beyond the 'Easing Bias': Preparing for a Hawkish Shift from the Fed Under Warsh and its Dollar Impact
The upcoming Fed meeting under new Chair Warsh could signal a significant policy pivot away from an easing bias. Prop firm traders need to understand the mechanics of this shift and how it will move USD pairs, bond yields, and risk assets in real time.

Geopolitical De-escalation and Oil: A Temporary Reprieve or a Structural Shift for Commodity and Currency Traders?
The reported halt in Iran-Israel attacks has temporarily eased oil prices and boosted global stocks. But prop firm traders must determine: is this a durable de-escalation or a headline-driven bounce that will reverse sharply? The answer defines your entire commodity and currency positioning framework.

Tech Sector Vulnerability: Lessons from the Asian Market Plunge
A sharp sell-off in Asian markets highlights the glaring vulnerability of high-growth tech stocks to rising yield expectations and hawkish Fed policies.

Central Bank Crossroads: Preparing for a Defining Macro Week
Traders brace for impact as the US CPI release and the ECB rate decision create the most consequential macro week of the year, promising intense volatility.

The Crypto Conundrum: Bullish Price Action Amidst Extreme Fear
Bitcoin rises while the Fear & Greed index screams Extreme Fear, presenting a complex conundrum for digital asset traders navigating mixed signals.

Dollar Dominance: How May's Blowout NFP Report Changes the Game
May's blowout NFP report has revived the higher-for-longer narrative, fundamentally shifting the near-term outlook for major forex pairs and requiring immediate strategic pivots.

Schwab Scraps PDT: Unleash Your Inner Prop Trader
The PDT rule is dead. This isn't just freedom; it's a mandate for hyper-disciplined intraday strategy. Here's how to leverage it without blowing up your account

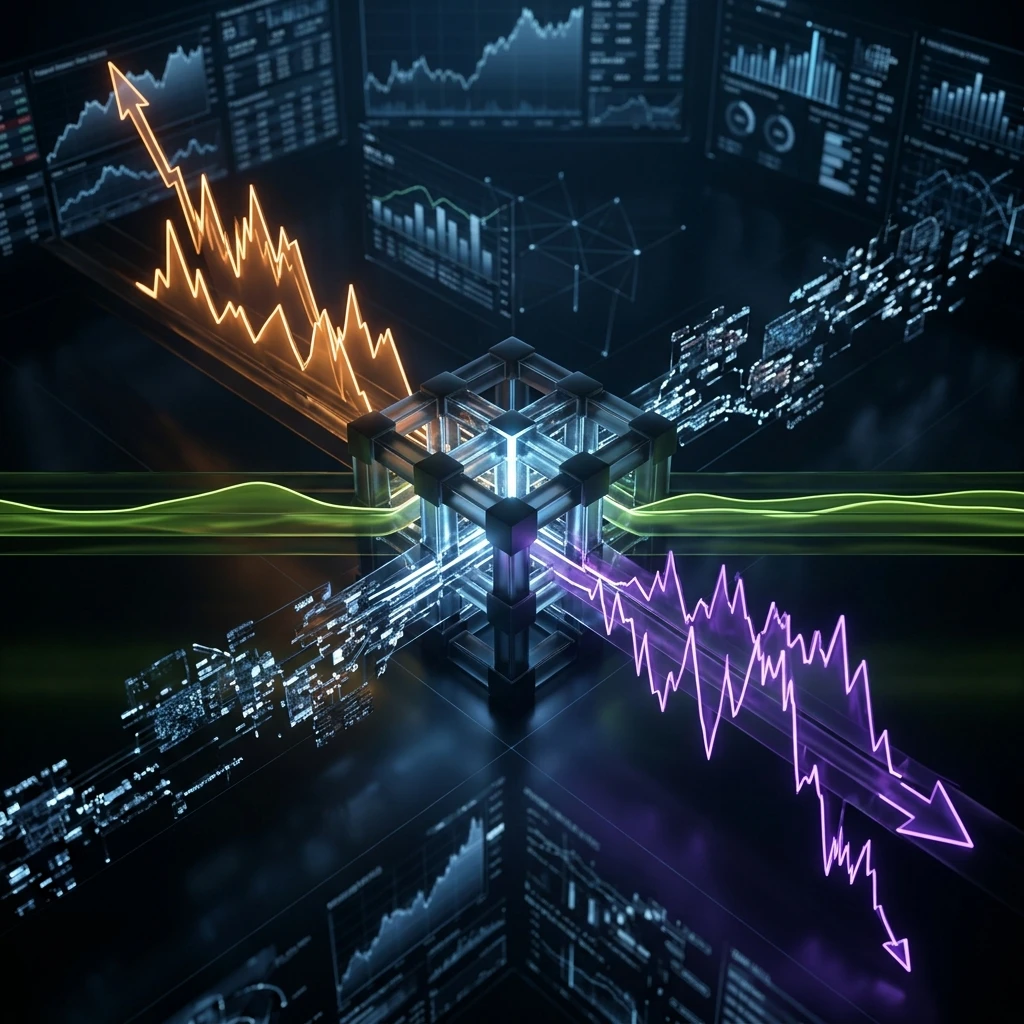
Contradictory Currents: Trading Broken Correlations
When macro forces pull assets in opposite directions, traditional correlations shatter. Learn to identify dominant drivers and manage risk

Divergent Drivers: Navigating Today's Conflicting Market Forces
Geopolitics, a hawkish Fed, and a tech sell-off are pulling markets in contradictory directions. Learn how to identify and trade the 'Divergent Drivers Dilemma' without b

Divergent Volatility: Navigating the Nexus Amidst Mixed Signals
Today's markets are a masterclass in conflicting narratives. Geopolitical oil shocks, a surging USD, and crashing Asian tech create a treacherous 'Divergent Volatility Ne

Geopolitical Paradox: Oil Soars, Gold Sinks – Prop Firm Risk Reset
Middle East tensions are spiking oil, but traditional safe havens like gold are collapsing. The market's conflicting signals demand a radical risk management reset
Multi-Vector Volatility: Trading Prop Firm Challenges in Conflicting Markets
Today's market isn't just mixed; it's a maelstrom of conflicting forces. Learn to identify dominant vectors, manage paradoxical price action, and protect your prop firm c

BRICS Gold Token: USD Hegemony's Slow Burn or Geopolitical Smoke?
Today's strong USD masks a quiet, long-term threat. The BRICS gold-backed token isn't just noise; it's a strategic de-dollarization play. Here's how to position your prop

Hawkish Hammer & Geopolitical Grinder: Trading Today's Dual Threat
Strong US jobs fueled Fed rate hike fears, crushing Nasdaq. Add geopolitical oil shocks, and you have a dual threat. Learn to navigate this volatility and find tactical p

Hawkish Headwinds: US Jobs & Your Prop Firm Edge
Strong US jobs data just stoked Fed rate hike fears, creating a treacherous landscape for equities and a surging dollar. Learn how to rebalance your risk and profit from

Nasdaq's AI Plunge: Prop Firm Playbook for Tech Risk Management
The Nasdaq just saw its worst day in over a year, with AI stocks leading the charge down. This isn't just a dip – it's a critical moment for prop firm traders to recalibr

Oil Shock Contagion: Prop Firm Playbook for Peak Volatility
Geopolitical oil spikes, hawkish central banks, and plunging equities define the market. Learn how to navigate the 'Hawkish Oil Shock Contagion' without blowing your prop
AI Bubble or Correction? Decoding Tech's Divergence Amid Mixed Markets
The Dow hits records while Nasdaq dips on AI stock pullback. Is it a healthy rotation or a warning? Prop traders must navigate this dual market reality for precision and

Bitcoin's Macro Tangle: Outflows, Fear, and Your Prop Firm Edge
Bitcoin's record ETF outflows and extreme fear aren't just crypto noise. It's a macro-driven de-risking event, treating BTC as a high-beta risk asset. Here's how to adapt

Central Bank Conundrum: Trading the Policy Paradox in Majors
Central banks are battling inflation with diverging strategies amidst mixed economic signals. Learn how to cut through the noise, identify true monetary policy divergence
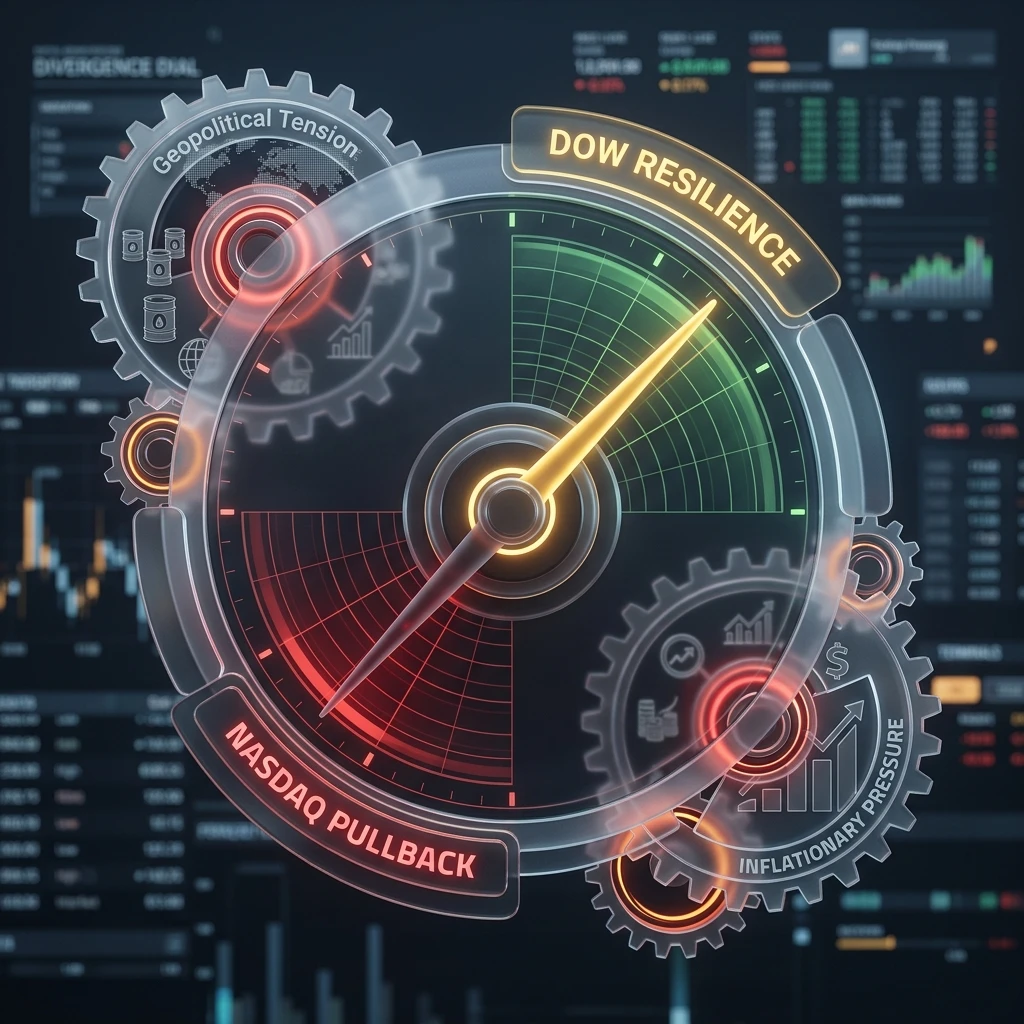
Prop Firm Tactic: Trading Geopolitical Divergence Drift
Today's market is a tale of two cities: Dow soars, Nasdaq dips. Geopolitical tensions and oil are the unseen forces driving this volatile divergence, demanding a new play

Yen's Dual Edge: Intervention, BOJ Hikes, & USD/JPY Risk Management
Japan's currency intervention and rising wages create a complex, two-way risk for USD/JPY. Understand the divergence between BOJ action and fundamental shifts for agile t

Bitcoin's $65K Breach: Institutional Exodus and Prop Firm Peril
Record ETF outflows signal a deep shift in crypto sentiment, turning Bitcoin's dip into a potential institutional capitulation. Prop firms must adapt or face liquidation

Fed's Hawkish Hold: Decoding Logan & Beige Book for USD & Bonds
The Fed's 'higher for longer' isn't rhetoric, it's a mandate. Unpack Logan's hawkish whisper and Beige Book's inflationary signals to navigate USD strength and bond volat

Geopolitical-Inflationary Vortex: Prop Firm Survival Guide
Middle East tensions, surging oil, and a hawkish Fed are creating a dangerous feedback loop. Learn how to navigate this geopolitical-inflationary vortex and protect your

Schwab's PDT Pivot: Leveraged Liberty, Prop Firm Discipline
Schwab's scrapping of PDT rules opens new doors, but for prop traders, this 'leveraged liberty' demands a new level of discipline. Don't let freedom become your downfall

USD/JPY 160: Prop Firm Survival Guide to BOJ Intervention
USD/JPY is testing 160.00, a critical line in the sand for the BOJ. Learn how to navigate potential intervention without blowing your prop firm account

Prop Firms: Crypto's Contagion Matrix & MicroStrategy's Pivot
Macro shocks and institutional selling are sparking crypto liquidation cascades. Prop firm traders must re-evaluate risk models and on-chain analytics to survive digital

Crypto's Two Speeds: Trading Institutional vs. Speculative Flow
Mastercard embraces stablecoins while Bitcoin ETFs bleed. Learn to navigate crypto's divergent forces and trade the real drivers of short-term price action

Geopolitical Inflation Spiral: Trading Divergence in a Bearish Market
Global inflation, fueled by conflict and protectionism, is forcing central banks into divergent stances. Learn how to identify and trade relative strength and weakness in

USD/JPY 160.00: The BOJ's Line in Sand & Prop Firm Survival
USD/JPY is nearing 160.00, a critical level that screams BOJ intervention. For prop firm traders, this isn't just a number; it's a volatility tripwire demanding precision

The AI Divergence Playbook: Navigating Tech's Ascent & Market Mix
Alphabet's massive AI investment highlights a two-speed market. Learn to leverage concentrated tech momentum while managing broader market volatility and concentration ri

ECB Hike Imminent: Prepping Your Euro Trades for June 10 Volatility
With a 92% chance of an ECB rate hike, the Eurozone is set for volatility. Learn how prop firm traders can strategically position and manage risk before the June 10 annou
Geopolitical Crosscurrents: Prop Firm Risk in a Volatile Market
Middle East tensions, hawkish central banks, and FX intervention threats are creating a high-stakes arena. Here's how prop firm traders can navigate amplified risk
USD/JPY at 160: The BOJ's Intervention Playbook for Prop Traders
Japanese Finance Minister warns of FX intervention as USD/JPY nears 160. Learn to decode BOJ signals, manage volatility, and protect your prop firm capital
AI's Narrow Rally: Exploit Fragility, Hedge the Hype
The AI boom pushes equities to new highs, but its concentrated nature signals underlying fragility. Learn how prop firm traders can tactically rotate and hedge
Central Bank Divergence: Your Prop Firm Edge in Volatile FX
As central banks split on policy, savvy prop firm traders can exploit interest rate differentials for high-probability setups. Learn to navigate today's mixed signals and

Geopolitical-Inflation Loop: Prop Firm Edge in a Mixed Market
Middle East tensions are fueling inflation and hawkish central banks, breaking traditional market heuristics. Prop firms need to master multi-asset correlations to naviga
Geopolitics & Policy: The Hidden Threat to Your Prop Firm Account
Middle East instability is rewriting central bank playbooks and amplifying inflation risks. Learn how to adapt your prop firm strategy to survive and thrive amidst the ne

US Data Week: Navigate the Fed's Hawkish Pivot
This week's ISM & labor data could validate or upend Fed rate hike bets. Prop firm traders must prep for divergent outcomes with precision and ironclad risk management

Macro Divergence: US Jobs vs. China PMI & Your Prop Firm Edge
The market's mixed signals reveal a critical divergence: strong US labor and weak China manufacturing. Learn how to navigate these conflicting currents, identify high-pro

NFP May's Jobs Report: Prop Firm Playbook for Fed & Forex
May's NFP report is a high-stakes event dictating Fed policy and forex volatility. Learn actionable strategies to navigate the post-release chaos and protect your prop fi
Solana's Edge: Trading Crypto's Pivotal Juncture
SOL is at a make-or-break technical support. Learn to blend TA and on-chain data to profit from crypto's volatility while managing prop firm risk

AI-Powered S&P 500: Geopolitical Storms Brewing for Index Traders?
Goldman Sachs raised its S&P 500 forecast to 8000 on strong AI earnings, but don't ignore escalating geopolitical tensions and hawkish central banks threatening this tech
Geopolitical Pendulum: Trade Volatility, Central Bank Divergence
Middle East tensions swing oil and safe havens. Central banks react divergently. Learn how to navigate the ensuing volatility and profit from macro shifts without getting

Gold's Geopolitical Tug-of-War: Trading the Haven's Dilemma
Gold is caught between de-escalation hopes and a strong dollar. Learn how prop traders navigate XAU/USD's conflicting narratives for actionable short-term trades
Two-Speed Market: Trading AI Boom vs. Geopolitical Headwinds
The market is bifurcating: AI-driven S&P 500 surges while geopolitical conflict fuels inflation. Learn to navigate this divergence with precision and iron-clad risk manag

The AI Valuation Supercycle: SK Hynix Crosses $1 Trillion and Why Index Concentration Risk Has Never Been Higher
In one week: SK Hynix hits $1 trillion, Anthropic eclipses OpenAI at $965B, and Dell/MongoDB blow out on AI revenue. The earnings supercycle is real — but the index concentration into 5-6 names is creating the most asymmetric risk profile in a decade.

Eurozone Inflation Accelerates: Why the ECB's June Rate Hike is Now a Near-Certainty
France, Italy, and Spain all posted inflation beats simultaneously — eliminating the ECB's last dovish escape route. Here's the EUR/USD trade setup for the June decision and why Panetta's 'no pre-commitment' language is deliberate misdirection.

Oil Down, Gold Up: How to Trade the Ceasefire-Inflation Divergence in Commodities
Oil and Gold are traditional safe havens and inflation hedges, but right now they are moving in opposite directions. Here is how prop firm traders can exploit this divergence as crude reacts to ceasefire headlines and gold reacts to sticky PCE inflation.
The Peace Dividend Paradox: Why a Ceasefire Doesn't Mean Clear Skies for Traders
The US-Iran ceasefire is cooling oil prices and lifting equities, but surging PCE inflation and a trapped Fed Chair Warsh mean the real volatility is just beginning. Here's your prop firm playbook.

RBNZ 'Sooner and Larger': The Prop Firm Playbook for Trading a Hawkish Central Bank Surprise
When a central bank uses the exact phrase 'sooner and larger' in its forward guidance, it is issuing a high-conviction directional signal. Here is how prop firm traders should trade the NZD/USD and NZD/JPY pairs in response to the RBNZ's hawkish pivot.

AI Paradox: S&P 500's Fragile Rally & Hidden Risks
The S&P 500 is soaring on AI euphoria, but beneath the surface, a concentrated rally and rising yields hint at deep vulnerabilities. Prop firm traders, don't get caught o

Geopolitical & Inflationary Pressure: Trading Forex Majors in the Crosshairs
The US-Iran conflict and persistent inflation create a volatile cocktail for forex majors. Understand how safe-haven flows, oil prices, and hawkish central banks are shap

Geopolitical Inflation Spiral: Trading EUR/USD & USD/JPY
Today's market is a crucible of geopolitical tension and stubborn inflation. Learn how to navigate the dual pressures impacting forex majors and why USD & JPY are poised

US Data Dump: Navigate Today's Volatility Vortex
Q1 GDP, PCE, Jobless Claims hit today. Understand the confluence of data and geopolitical crosscurrents to manage risk and exploit opportunity in USD pairs and indices

Yield Shock: Bitcoin's Emergence as the Ultimate Macro Hedge
Sovereign bonds are under unprecedented pressure, with US and Japanese yields surging. Is traditional fixed income dead? We break down why Bitcoin is gaining traction as

APAC Hawkishness: Decoding Divergent Central Bank Signals
RBNZ, BOJ, RBA deliver hawkish signals, but the nuances matter. Learn to dissect central bank communication for high-probability setups and avoid the traps of mixed senti

China's Profit Boom: The Divergent Demand Playbook
Geopolitical storms rage, but China's industrial surge from AI and oil creates a powerful counter-narrative. Learn to trade divergent demand without chasing headlines.

Earnings Divergence: Your Prop Firm Edge in Mixed Markets
Amid macro noise, individual earnings reports offer high-conviction trading opportunities. Discover how to find alpha in the data center boom and leverage earnings diverg

Prop Firm Playbook: Fortifying Portfolios Against Geopolitical Shock
US-Iran tensions are reshaping safe-haven dynamics. Learn how to recalibrate your prop firm portfolio, manage volatility, and protect capital when the geopolitical fuse i

Central Bank Divergence: Trade the ECB & RBNZ's 'Wait & See'
While the RBNZ and ECB preach patience, their subtle shifts create powerful currency divergence. Learn to spot the hidden carry and trend opportunities in NZD and EUR pai

Geopolitical Whiplash: Trading Oil & USD Amidst US-Iran Tensions
US-Iran tensions are whipping oil and USD. Learn to navigate sudden geopolitical shifts, protect your capital, and spot high-probability setups when headlines dictate mar

Prop Firm Survival: Trading Geopolitical Whipsaws in Oil & USD
Geopolitical tensions are a double-edged sword for prop traders. Master the volatility loop in oil and USD to safeguard your challenge and capitalize on high-impact macro

Trading Geopolitical Fire: Oil, USD, and Hormuz Volatility
US-Iran tensions are back, sending oil and USD on a wild ride. Learn to navigate the Strait of Hormuz shockwaves and turn geopolitical uncertainty into actionable trading

The Hormuz Horizon: Trading the Geopolitical De-escalation Narrative
As tensions cool in the Strait of Hormuz, we map out the technical and fundamental plays for the imminent market re-pricing.

Michael Burry's Nvidia Warning: Is the Tech Rotation Finally Here?
The 'Big Short' investor has taken a massive put position against Nvidia. Is this the catalyst for the long-awaited tech sector rotation?

The Earnings Season Paradox: Why S&P 500 Concentration is a Hidden Risk
The S&P 500 looks healthy on the surface, but underneath, a dangerous concentration risk is brewing. How traders should navigate the earnings paradox.

The Iran Peace Deal: A Double-Edged Sword for Forex Traders Navigating Oil Volatility
As geopolitical tensions show signs of de-escalation, forex and commodity traders must prepare for violent market re-pricing.

The New Fed Chair's Independence: A Double-Edged Sword for Dollar Bulls and Bears
Kevin Warsh's transition into the Fed Chair role brings a new era of hawkish independence. Here is how it reshapes the USD landscape.

Goldman's Dollar Strength Call: How to Position for a 'Higher-for-Longer' Greenback
With Goldman Sachs doubling down on US Dollar strength, we analyze the structural forces driving the DXY and how to trade the prolonged trend.
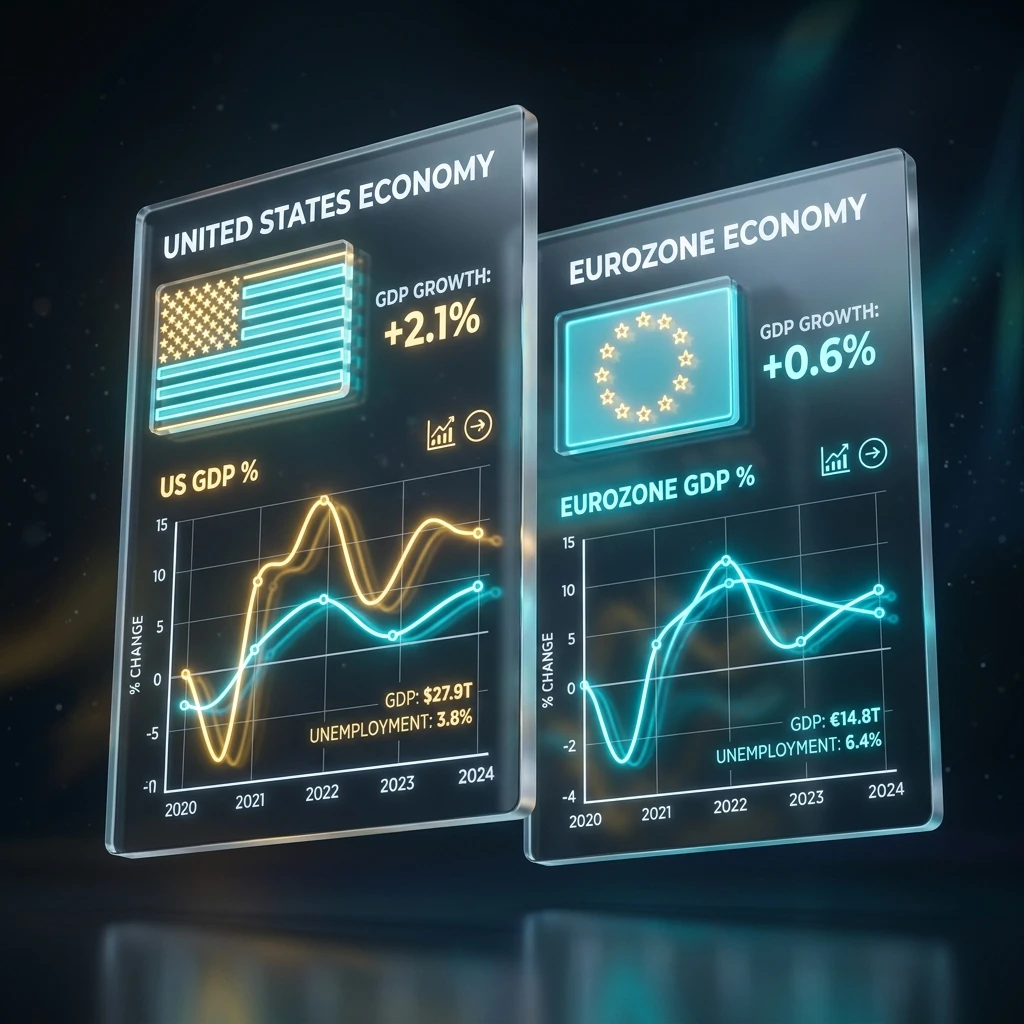
The Diverging Paths: Trading the Widening Economic Gap Between the US and Eurozone
As the US economy shows resilience, the Eurozone grapples with stagnation. Here is how prop firm traders can capitalize on the widening macro divergence.

Beyond the Hype: Why Nvidia's Stellar Earnings Couldn't Ignite a Broader Market Rally
Nvidia delivered record profits, but the market yawned. We break down the 'priced-in' paradox and what it means for tech sector traders.
BOJ's Hawkish Pivot: Unwinding the Great Yen Carry Trade
The Bank of Japan's potential June rate hike signals a seismic shift, unwinding decades of ultra-loose policy. Prop firm traders must re-evaluate JPY pairs, carry trades,
Geopolitical Elasticity: Trading Oil Shocks & Central Bank Plays
Iran's uranium directive, $100 oil, and struggling Eurozone PMIs signal a new era of geopolitical market elasticity. Learn to trade the ripple effects on Forex and commod

Geopolitics: Your New Volatility Amplifier
US-Iran tensions are not just news; they're warping intermarket correlations and demanding a sharper edge in risk management. Don't get caught flat-footed

Hormuz Threat: Prop Firm Survival in Geopolitical Shockwaves
The Strait of Hormuz threat isn't just news, it's a direct challenge to your prop firm capital. Understand the four waves of geopolitical shock and how to adapt your stra
PMI Divergence: Trade US Resilience, Short EUR/GBP Weakness
Eurozone and UK services PMIs contracted sharply while US activity remained resilient. This stark divergence sets up clear directional trades for prop firm challengers

CVD as a Leading Indicator: Spotting Crypto Exhaustion with Cumulative Volume Delta
With spot crypto registering 9 consecutive days of selling, we detail how to use Cumulative Volume Delta (CVD) to identify market exhaustion and spot high-probability reversals.
The Long Bond Breakout: What 5%+ 30-Year Yields Mean for Equity Traders
The U.S. 30-year Treasury yield has surged to its highest level since July 2007. We break down the mechanical impact on equity valuations and how to restructure your watchlist.

Reading Between the Fed's Lines: How to Parse FOMC Minutes Like a Pro
As Kevin Warsh takes the helm, parsing Powell's final FOMC minutes is crucial. We present a three-step framework for deciphering Fed language and predicting rate path shifts.

Retail Turnaround Trades: Spotting Inflections Before the Crowd in Target Earnings
Target stock is up 30% YTD ahead of earnings as same-store sales return to growth. We analyze the turnaround mechanics and how to identify retail trend inflections.

The 90% Certainty Trap: How Consensus Positioning Creates Post-Earnings Traps
Polymarket shows a 90% implied probability that Nvidia beats earnings tonight. We analyze how high consensus positioning creates asymmetric downside risk and how to trade it.

Reading Between the Lines: Why Home Depot's 'Beat but Fell' Signals Consumer Caution
Home Depot beat Q1 consensus earnings but reported falling profits and flat guidance. We analyze the retail data to show how 'headline beats' can mask structural consumer slowdowns.

Multi-Decade Yield Highs: The Hidden Tax on Retail Portfolios
Treasury yields have climbed to their highest levels since 2007, sparking a broad equity sell-off. We explain what high yields mean for retail traders and how to hedge your funded account.

Biotech Speculation: Trading the Ebola Emergency Spikes and Fades
The WHO has declared an Ebola emergency, triggering algorithms to spike small-cap biotech stocks. We dissect the anatomy of pandemic speculation and how to trade the fade.

The Nvidia Earnings Playbook: Managing Risk Pre, During, and Post-Print
With consensus expecting a massive 120% growth rate, tonight's Nvidia Q1 print is the most critical event of 2026. We deliver the definitive trading playbook.

Binary Event Trading: Navigating Geopolitical Whipsaws Without Gambling
Trump calls off the Iran attack, sparking massive market relief. We analyze how to manage risk before high-impact binary geopolitical events without turning your account into a roulette wheel.

When One Sector Drives Everything: Reading Concentration Risk in Index Positions
Semiconductor stocks now make up 18% of the S&P 500's market cap, driving over half of the index's year-to-date gains. Let's analyze the concentration risk this poses for portfolios.

The Hidden AI Trade: Why Power Infrastructure is the Real Pick-and-Shovel Play
NextEra's historic $66.8B acquisition of Dominion Energy confirms the ultimate AI pick-and-shovel trade: power infrastructure. Here's why data center energy demand is reshaping macro markets.

Pre-IPO Stock Splits: What They Signal and How to Trade the Listing Week
SpaceX's confirmed 5-for-1 stock split adjusts share price to $105.32 and values the company at $1.75T. Let's analyze what pre-IPO stock splits signal to secondary markets.

Leverage and Liquidation Cascades: What Crypto Teaches Prop Firm Traders
Bitcoin's $500M overnight long liquidation cascade offers critical lessons for prop firm traders. Learn how leverage cascades work and how to insulate your funded account.

How to Survive Headline-Driven Markets: Why Reacting to Every Post Loses Money
Monday's market was whipsawed by erratic Iran headline risk. Learn the psychology of headline-driven markets and why reacting to every post is a guaranteed way to lose capital.

Nvidia's 4 Consecutive Earnings Beats: How to Trade a Beat-and-Raise Cycle
Nvidia has beaten consensus EPS estimates for four straight quarters. We break down the entry timing mechanics, the 'raise' signal, and how to position before and after May 20 earnings.

BlackRock's 'No Inconsistency': Why Markets Can Rally During a War — The AI Offset Thesis
BlackRock's Investment Institute says U.S. stocks hitting all-time highs with Hormuz closed is not a contradiction. Here's the data-driven framework behind their pro-risk stance.

Sentiment vs. Spending: Why UMich and Walmart Tell Different Stories About the American Consumer
University of Michigan consumer sentiment sits near record lows. Yet Americans are still shopping. Walmart earnings this week will settle a debate that has split Wall Street for three months.

SpaceX S-1 This Week: The IPO Effect on Index Flows and What Traders Need to Know Before SPCX Lists
The SpaceX prospectus drops as early as May 22. With a $1.75–$2 trillion target valuation and xAI embedded, this is not just an IPO — it is the largest index rebalancing event in Nasdaq history.

Chasing the 7th Week: Why Late-Trend FOMO Is the Most Dangerous Trade You'll Make
The S&P 500 just completed its 7th consecutive green week — elite territory statistically. Here's the behavioral finance case for why entering a trend in week 7 is structurally different from entering in week 2.

Bitcoin as a Liquidity Barometer: Using Crypto to Read Risk-Off Signals in Forex
Bitcoin's 3% slide back under $80,000 isn't just about crypto—it's a leading indicator for global liquidity and yield-driven risk-off sentiment.

7 Consecutive Green Weeks: How to Read a Bull Market That Ignores Bad Data
Despite war jitters and rising oil, the S&P 500 is on its longest winning streak since 2023. Here's how to trade the psychological divergence.

The Hormuz Trader's Playbook: Positioning for Ceasefire vs Escalation Binary
With a 14-point Iranian proposal on the table and ship seizures in the Strait, oil markets are at a knife's edge. Here is your weekend strategy.

SpaceX IPO S-1: How Mega-Cap IPOs Distort Index Flows and What Traders Should Expect
With the SpaceX prospectus imminent and a $2 trillion valuation target, the Nasdaq's 'Fast Entry' rule is set to trigger massive rebalancing.
Trading Like the President: Overtrading, FOMO and the Cost of Chasing Headlines
Donald Trump's 3,600 trades in Q1 highlight a common retail trap: the belief that proximity to news requires constant execution.

The Essential Indicator Stack: What Actually Works for Prop Firm Challenges in 2026
Most indicators are lagging, reactive, and noisy. For a prop firm challenge, you need data that identifies institutional intent and real-time volatility. We break down the only 4 indicators you actually need.

BTC as a liquidity barometer — reading crypto to time risk-off in forex
Bitcoin fell nearly 3% today as yields spiked. Here is why traders use BTC as a high-beta liquidity barometer to time risk-off shifts in the FX markets.
New Fed Chair, old problem — how Warsh inherits an impossible position
Kevin Warsh takes over as Fed Chair on Jerome Powell's last day. With 45% rate hike odds and a yield spike, the honeymoon period is officially over before it began.

How rising rate hike probability changes prop firm challenge strategy
Fed rate hike odds have jumped to 45% in a single month. For prop firm traders, this shift in the interest rate regime requires a total overhaul of risk parameters.
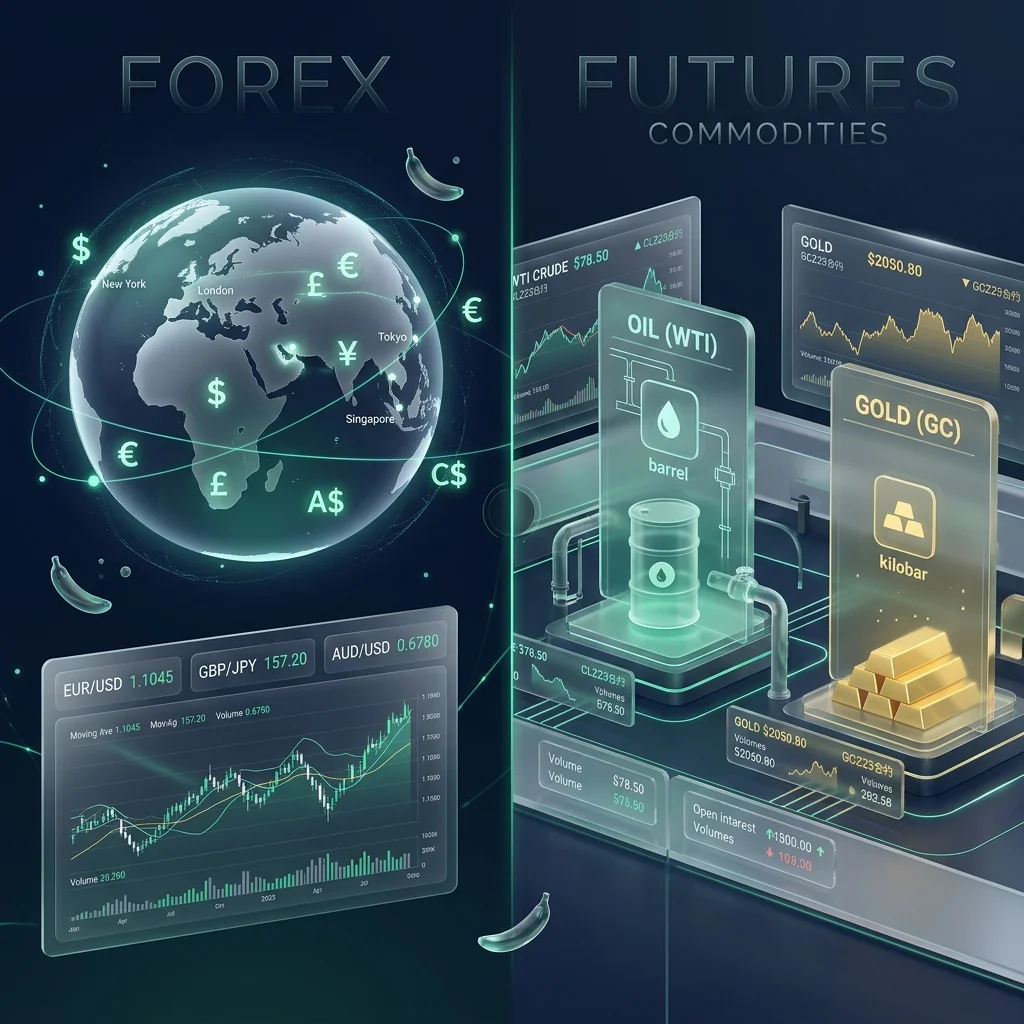
Forex vs. Futures: Which Market is Best for Prop Firm Trading in 2026?
Choosing between the decentralized Forex market and the centralized Futures exchange is the most important decision a trader makes. We break down the math, liquidity, and prop firm requirements of both.

What 'no deal' summits actually mean for oil markets — the trader's framework
The Trump-Xi summit ended with no major trade breakthroughs, but a surprise 'oil twist' sent Brent crude above $107. Here is the framework for trading geopolitical summits.

When consumers panic but markets don't (yet) — the divergence traders should track
The University of Michigan Consumer Sentiment dropped to a record low of 48.2 today. Here is why traders need to watch the divergence between Main Street and Wall Street.

How to read PPI breakdowns: goods vs services — why traders miss the real signal
The U.S. Producer Price Index rose 1.4% in April 2026, driven significantly by services. Here is why the breakdown matters more than the headline number.

Powell out, Warsh in — does the Fed pivot narrative survive hot CPI + PPI?
Kevin Warsh's confirmation as the new Fed Chair arrives alongside back-to-back inflation shocks, complicating the narrative for a dovish policy pivot.

First Hormuz transit in months — what it means for oil, inflation & risk sentiment
A Chinese supertanker has successfully exited the Strait of Hormuz after a two-month blockade, signaling a potential shift in oil war premiums.
How back-to-back inflation shocks change prop firm risk parameters
With the market-implied probability of a rate hike jumping to 39%, funded traders must adapt their risk models to survive rapid volatility shifts.
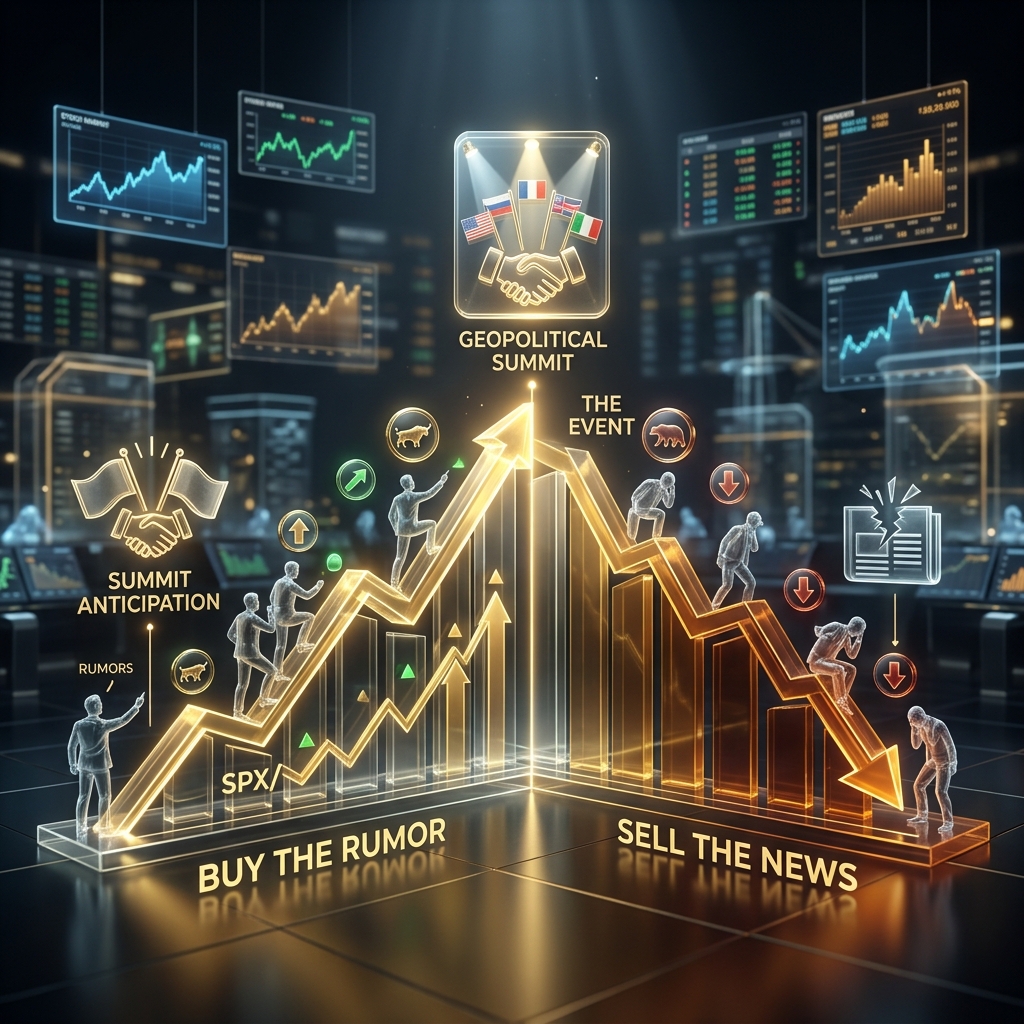
Trading the 'buy the rumour, sell the news' pattern on geopolitical summits
The Trump-Xi summit concluded its first day with a status quo statement, highlighting the psychological trap of trading high-stakes geopolitical events.
Analytics: Tracking the Yen's Quiet Dominance in the Asia Session
A data-driven look at session-by-session currency strength, highlighting the Japanese Yen's outperformance against the Australian Dollar.

The Powell Era Ends: What a Warsh Fed Means for Rate Expectations
As Kevin Warsh prepares to succeed Jerome Powell, markets must recalibrate their long-term rate expectations amidst sticky inflation and hawkish dissent.

Energy as Sticky Inflation: Iran Rebuilds Hormuz Missile Sites
US intelligence reports indicate Iran has restored access to 30 missile sites along the Strait of Hormuz, cementing energy as the primary driver of sticky global inflation.

Prop Firm Survival: Navigating Back-to-Back Inflation Spikes
With PPI following a hotter-than-expected CPI print, funded traders must implement strict volatility protection protocols to survive the inflation whip.
Trading FOMO During the Trump-Xi Geopolitical Summit
As the high-stakes US-China summit begins, we analyze the psychological trap of trading geopolitical uncertainty and how to manage headline FOMO.

Bank of Japan Delivers Hawkish Surprise Amid Iran Energy Spillover
While holding rates at 0.75%, the BoJ sharply revised inflation forecasts upward, citing elevated crude oil prices and signaling a growing hawkish minority.

Euro Battles Descending Channel Resistance Ahead of Critical US CPI Data
The EUR/USD hovers near $1.1760, pressing against key descending channel resistance as markets await US inflation data to dictate the next momentum shift.

Market Pulse: Nasdaq Hits Record High Despite Mega-Cap Tech Drop
The Nasdaq Composite and S&P 500 reached fresh record highs as resilient broader market participation offset notable declines in Magnificent Seven heavyweights.

Tesla Secures Diplomatic Boost: Musk Invited to US-China Tech Summit
Tesla shares jumped 4% following reports of a high-profile diplomatic trip to China, offering long-term optimism amid intense domestic EV competition.

Markets on Edge Awaiting Trump-China Tech Summit Readout
As geopolitical tensions simmer, traders closely monitor the outcome of the high-stakes US-China summit, which could trigger massive shifts in risk appetite.
Hot US CPI Print Kills 2026 Rate Cut Hopes as Energy Costs Surge
Headline CPI hits 3.8% YoY, shattering expectations and driving Treasury yields higher as traders price out any potential Federal Reserve rate cuts for 2026.
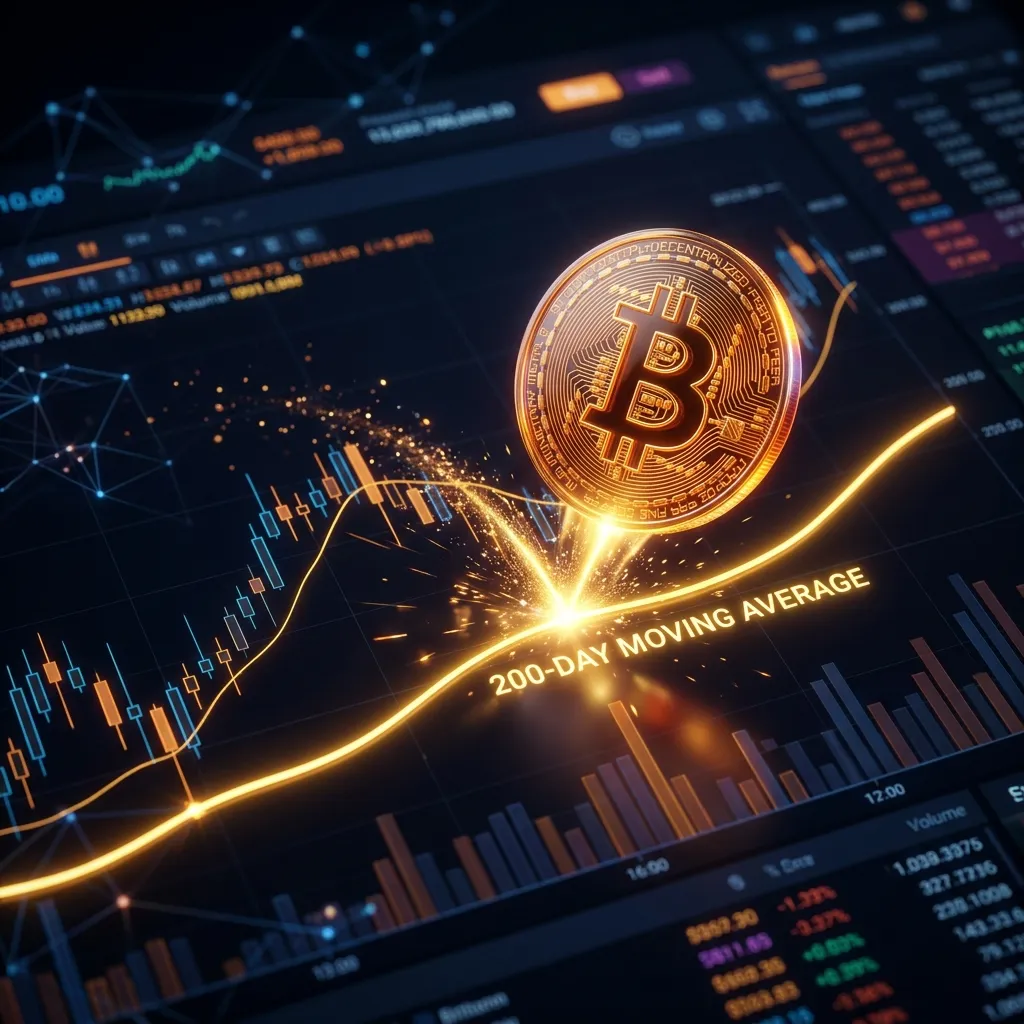
Bitcoin Bulls Defend the Line: Major Bounce Off 200-Day MA
Bitcoin has successfully defended its long-term trend line, bouncing off the 200-day moving average as institutional buyers step in to protect the current bull cycle.

Tech Diplomacy: Musk and Cook Join Trump for Xi Jinping Summit
Elon Musk and Tim Cook are set to accompany Trump for an upcoming summit with Xi Jinping, signaling a heavy tech focus on future trade relations, while Nvidia's Jensen Huang remains absent.
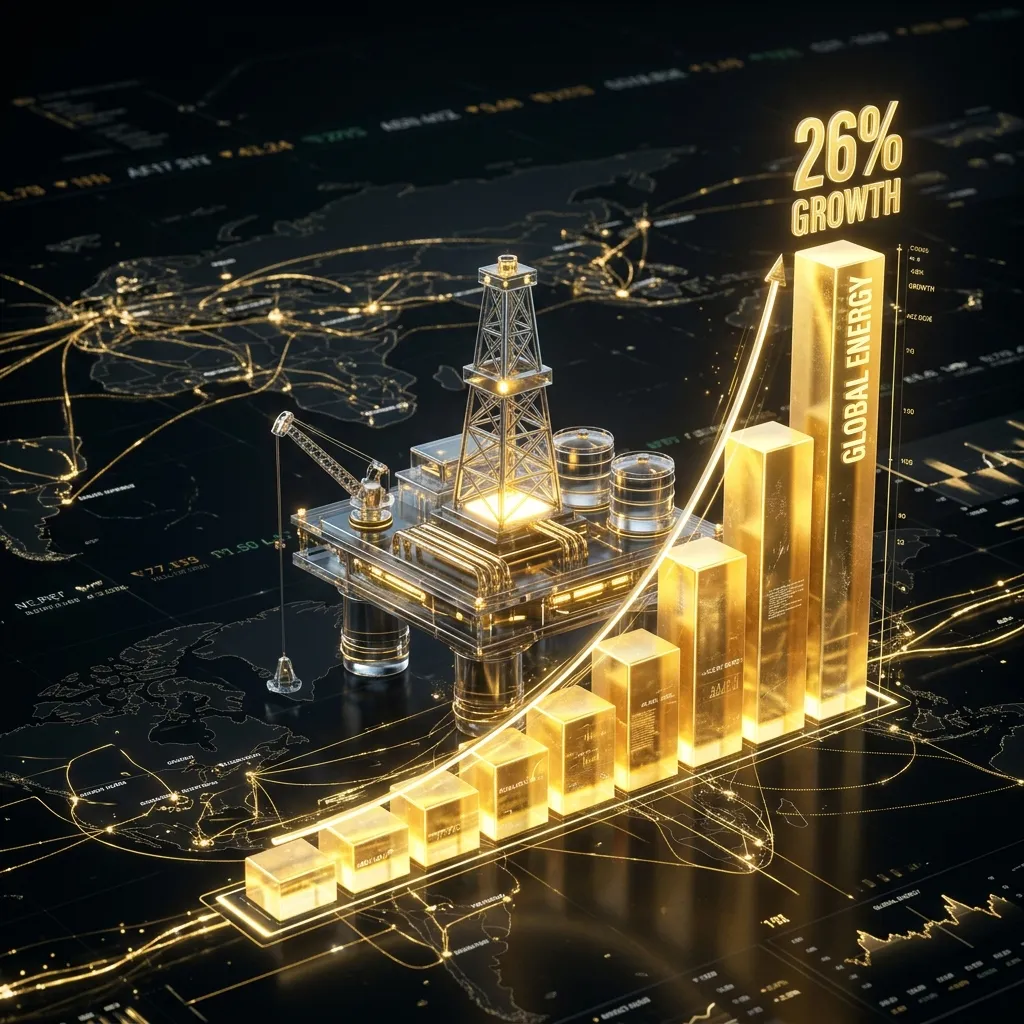
Energy Surge: Saudi Aramco Reports 26% Growth in Q1 Net Income
Saudi Aramco set the tone for energy markets with a 26% surge in Q1 net income, driven by robust demand and strategic pricing power.

Market Slide: Trump Rejects Iran Peace Offer, S&P Futures Drop
Market sentiment soured as Donald Trump dismissed a peace proposal from Iran, sparking a Gold correction and pressure on equity futures.

The Hormuz Peace Memorandum: Oil Prices Slide as Geopolitical Premium Evaporates
A surprise diplomatic memorandum regarding the Strait of Hormuz has triggered a sharp 4% correction in crude oil prices. We analyze the macro shift from war premium to supply fundamentals.

The ATH Trap: Why Volume Divergence at Record Highs Signals a Liquidity Flush
As markets touch new all-time highs, a subtle divergence in trading volume is creating a 'Liquidity Trap' for retail traders. We analyze the technical signatures of the coming flush.

The AI Infrastructure Supercycle: How Generative Compute Flow is Reshaping Trade Execution
As the AI infrastructure supercycle accelerates, a new 'Compute Flow' is emerging in high-frequency trade execution. We analyze the shift from technical to neural dominance.

The CPI Protection Protocol: Managing Volatility to Protect Your Funded Account
CPI day is the number one killer of prop firm accounts. We outline a strict 'Protection Protocol' to help you navigate the spike without breaching drawdown limits.

The CPI Anxiety Loop: Managing FOMO When Macro Data Clashes with Your Bias
With inflation data on the horizon, many traders fall into an 'Anxiety Loop,' oscillating between fear of loss and fear of missing out. Here is how to audit your biological response.

The Adrenaline Hangover: Biological Recovery After High-Volatility Trading
Trading high-volatility events like the Hormuz oil spike leaves a lasting biological 'hangover.' We explore the science of adrenal recovery and how to reset for the next session.

Tech Tumble: Nasdaq Drops 1% Amid OpenAI Concerns and Chip Sell-Off
An alarming report regarding OpenAI triggered a broad sell-off in semiconductor stocks, dragging the Nasdaq Composite down 1% and highlighting AI sector vulnerability.

Starbucks Surges 6%: A Caffeine Boost for Consumer Sentiment
Starbucks stock rallied 6% after a strong earnings beat and raised full-year outlook, signaling robust consumer discretionary spending.

UBS Profits Surge 80%: The Trading Desk Renaissance
UBS reported an 80% profit surge to $3 billion, driven by exceptional trading desk returns. We analyze what this means for institutional volatility.

Gold Prices Shed 1.2% as Support Gives in Ahead of Fed Decision
Gold experienced a sharp 1.2% drop as technical support levels broke down in anticipation of the Federal Reserve's upcoming interest rate decision.

S&P 500 Clinches Fresh Record Close Ahead of Mag 7 Earnings
The S&P 500 reached a new all-time high as market sentiment shifts bullish ahead of critical earnings reports from the Magnificent 7.

Japanese Yen Seesaws as BOJ Holds Rates, Signals Potential June Hike
The Japanese Yen experienced volatile seesaw price action following the Bank of Japan's decision to hold interest rates, amidst split voting that hints at a June rate hike.

Bitcoin Climbs Toward $80,000 as Pent-Up Demand Trickles In
Bitcoin prices steadily climbed toward the $80,000 threshold as institutional and retail pent-up demand slowly trickled back into the cryptocurrency market.

Nasdaq Futures Erase Early Losses as Traders Look Past War Jitters
Nasdaq futures recovered from early session losses as market participants absorbed geopolitical tensions and refocused on core economic data.

US Dollar Elevated Near Multi-Year High Against Yen Ahead of Rate Decisions
The US dollar stayed elevated near a multi-year high against the Japanese yen as currency traders await looming interest rate decisions.

Biological Optimization: The Hidden Engine of Trading Execution
Why do you 'paper-hand' winners and 'revenge trade' losers? The answer isn't in your strategy—it's in your biology. Discover the biological basis for professional trading.

Case Study: The PharmaCorp Acquisition and Retail Medical Velocity
PharmaCorp is acquiring eight pharmacies for $24.2 million. We break down the M&A math and what it reveals about the health of the retail medical sector.

Chicago Grain Futures: Decoding the Energy Correlation Drift
Why are grain futures falling despite global supply concerns? Learn how retreating oil prices and US weather outlooks are creating a unique volatility cluster.

The $2B Osaic Recapitalization: A Proxy for Private Wealth Liquidity
Reverence Capital Partners has closed a massive $2B deal for Osaic. What does this 're-upping' of private equity say about the broader market's liquidity ceiling?

Crude Highs and Prop Rules: Managing Energy Volatility
US crude oil output hit a two-month high in February. For funded traders, this peak production creates unique drawdown risks. Here's how to stay funded.

The Psychology of Weather Shocks: Navigating Untrackable Risk
How do you trade when the catalyst is the weather? Learn how to manage the emotional volatility of commodity reversals driven by 'untrackable' data.

Q1 Earnings Audit: The Velocity Divergence of CNX and T. Rowe Price
CNX Resources tops EPS at $2.18 while T. Rowe Price hits $2.23. We audit the data to see which sector is showing true institutional strength.
The Tax Refund Squeeze: How Energy Inflation is Eroding Consumer Capital
Bank of America reports that high gas prices are eating up consumers' tax refunds, a trend that mirrors the 'Margin Squeeze' many traders face in volatile energy markets.

EPCI Excellence: Subsea 7’s Strategic Engineering Win in Angola
Subsea 7 has secured a substantial contract from ExxonMobil for Block 15 in Angola, highlighting the ongoing capital expenditure in global energy infrastructure.

Gold Repatriation: The RBI’s 104-Tonne Shift to Domestic Vaults
The Reserve Bank of India has moved 104 tonnes of gold to its domestic vaults, a massive shift in forex reserve strategy that underscores a growing trend of central bank self-reliance.

The AI CapEx War: Alphabet’s Records vs Meta’s Tumble
Alphabet rockets to fresh records while Meta stock tumbles on CapEx worries, illustrating the high-stakes 'Arms Race' in AI infrastructure and infrastructure investment.

Watchdog Regulation: How Small Lending Data Rules Impact Retail Liquidity
The US consumer finance watchdog has finalized new rules on small lending data, a move that could redefine the liquidity landscape for retail and prop firm traders.

Biological and Digital Resilience: Navigating Outbreaks and Breaches
As France reports new bird flu outbreaks and probes a massive ID data breach, the need for biological and digital 'Stop Losses' has never been more critical.

Volatility Clustering: Trading the Q1 2026 Earnings Flurry
With CNX, T. Rowe Price, and Service Corp International reporting, we break down the math of volatility clustering and how to manage risk during high-density weeks.

Widebody Velocity: A Case Study in Post-Pandemic Resilience
As Rolls-Royce holds its guidance steady and widebody engine travel recovers, we analyze the metrics of long-term recovery momentum.
Intervention Logic: Japanese Yen Shocks and the RBI’s Gold Strategy
As Japan intervenes in the Yen and the RBI shifts 104 tonnes of gold, we analyze the shifting tectonic plates of global forex liquidity.

Mega-Cap Divergence: Alphabet Records vs. Meta’s CapEx Tumble
As Alphabet hits new highs on massive CapEx targets, Meta slides 7% despite a double beat. We analyze what this tech divergence means for funded trader liquidity.

Neural Ubiquity: Google’s Gemini AI Hits the Open Road
As Gemini AI integrates into cars and DZYNE Technologies secures Air Force contracts, the neural footprint is expanding far beyond the trading desk.

The Wellness Pivot: GLP-1 Demand and the MAHA Health Movement
From Hershey's shift toward healthier snacks to the rise of the MAHA movement, we analyze the biological optimization trends reshaping trader performance.

Earnings Velocity: An Analytical Deep-Dive into Q1 2026 High-Volume Revenue Clusters
Analyzing the rapid-fire Q1 2026 earnings results from CNX Resources, T. Rowe Price, and Service Corp International.

The PE Exit: Why Thoma Bravo’s Refusal to Medallia Signals a New Corporate Era
A case study in institutional sentiment shift as private equity giant Thoma Bravo reportedly refuses fresh cash for Medallia.

Macro Retreat: Commodity Prices Slide as Gas Price Tax Refunds Hit Consumer Pockets
While grain and oil futures retreat, Bank of America reports that high gas prices are consuming tax refunds—creating a 'Liquidity Trap' for the US consumer.

The ML Infrastructure Boom: Google and Xcel Energy’s Massive Data Center Power Deal
As Xcel Energy and Google finalize a massive infrastructure deal, we analyze the impact of high-output energy on the future of predictive ML trading coaches.

The Intervention Shield: How to Protect Funded Accounts During Central Bank USD/JPY Shocks
Japan's currency intervention has sent the U.S. dollar sliding against the Yen. Learn how to navigate these high-slippage events without losing your prop firm account.

Biological Resilience vs. Digital Breaches: Navigating the Bird Flu Outbreak and Data Privacy
How localized outbreaks in France and teenage-linked data breaches create a state of 'Systemic Fragility' for the modern trader.
The Cook Departure: Apple Tumbles as Tech Titans Diverge
A shock resignation from Tim Cook sent Apple shares into a tailspin, overshadowing record earnings from Alphabet and Amazon. We analyze the resulting sector rotation.

The $PSUS Flop: A Case Study in Institutional Sentiment & Retail Exhaustion
Bill Ackman's highly anticipated fund debut dropped 18% from its IPO price on day one. We audit the data behind the flop and what it tells us about current market sentiment.

Sovereign Gold: Why the RBI is Recalling 100+ Tonnes of Bullion
In a massive shift for global forex reserves, the Reserve Bank of India has moved 104 tonnes of gold to domestic vaults. We analyze the macro implications of sovereign repatriation.

The AI Arms Race: How Alphabet & Anthropic are Scaling the Next Generation of Trading Coaches
As Alphabet boosts its Capex and Amazon invests $25B in Anthropic, the infrastructure for real-time AI trading coaches is reaching critical mass. We analyze what this means for the predictive edge.
Black Swan Protocol: Protecting Your Funded Account During CEO Shakeups
Sudden leadership changes at mega-cap firms like Apple can trigger 'Black Swan' volatility. Learn how to shield your prop firm account from liquidation when the news hits.

The GLP-1 Disruption: Managing Biological Cravings in a High-Sugar Market
As Hershey tops estimates driven by GLP-1 users' shift toward mints and healthy snacks, we explore the biological optimization behind the 'MAHA' health movement.

Mid-Week Liquidity: The Comprehensive Guide to Wednesday Reversals
Wednesdays often mark the structural pivot of the trading week. This guide breaks down the data behind mid-week liquidity shifts and how to navigate them using Toastlytics metrics.

Wednesday Whirlwind: Geopolitical Relief vs. Inflation Fears
Mid-week volatility hit a crescendo today as cooling Hormuz tensions clashed with rising US inflation expectations. We analyze the institutional tug-of-war.

The Biological Stop-Loss: Managing Cortisol During Drawdown
Your body reacts to a losing streak before your brain does. We explore the neuroscience of drawdown and how to implement a biological stop-loss.
The Precision Audit: How One Trader Eliminated 15% Slippage
Slippage is the silent killer of funded accounts. Discover how a breakout trader used Toastlytics Precision Metrics to identify and fix a 15% execution leak.

Smart Detection 1.0: How Neural Signatures Identify Your Broker
We just shipped a major update to the Toastlytics Brain. Learn how our new Smart Detection engine identifies 22+ platforms and 30+ brokers with 99.9% accuracy.

Tuesday Turnaround: Spotting the Institutional Rotation
Following a volatile Monday open, the markets saw a classic institutional rotation today. We look at the data behind the 'Tuesday Turnaround' and why the NY session shifted sentiment.

Monday Momentum: Analyzing the Asian Session Liquidity Trap
Monday morning is the most dangerous time for retail traders. We break down the 'Fake-Out' data from this morning's open and how to avoid the 9:00 AM trap.

Sunday Market Prep: Positioning for the FOMC Hawkish Tilt
As the market opens for the final week of April, all eyes are on the Fed's next move. Here is how to audit your weekend exposure and prepare for the volatility ahead.

The Silicon Pulse: How Generative AI is Rewiring Trader Intuition
The era of the 'gut feeling' is evolving. Discover how generative models are acting as a cognitive bypass for traders, turning noise into actionable signal.

Circadian Execution: The Biological Timing of Your Peak Profitability
Are you a London Session bull or a NY Session bear? Discover how your circadian biology dictates your edge and why timing is more than just a timezone.

The 48-Hour Recovery: Anatomy of a Funded Account Rescue
We audited a 50k funded account that was 0.5% away from breach. Discover the data-driven steps that turned a near-failure into a payout.

Anatomy of a Losing Streak: 3 Hidden Signals the AI Coach Identifies Before You Blow Up
We trained our AI on 10,000+ failed trading sessions. Discover the 3 subtle data patterns that predict an account breach before it happens.

Friday Close: The April Performance Audit
The final Friday of April is here. It's time to close the books, audit your execution, and prepare for the transition into May.

The Hormuz Blockade: Assessing the $120 Oil Contingency
Geopolitical tensions in the Strait of Hormuz have reached a critical threshold. We analyze the macro-economic fallout and what a $120 oil scenario means for the USD.

Why Spreadsheets are Dangerous: The Case for Emotion-Aware Journaling
Static spreadsheets are a liability for modern prop traders. Discover why emotion-aware journaling is the only way to build a sustainable trading career.
The Math of the Abyss: Why Drawdown is a Mathematical Trap
Recovering from a 50% loss requires a 100% gain. This is the 'Asymmetry of Loss.' This 2,000-word guide breaks down the math of recovery and how to avoid the point of no return.

Why Win Rate is a Vanity Metric: Introducing the Toast Score Standard
Is your 70% win rate making you go broke? Learn why high win rates are often a trap and how the Toast Score provides the institutional truth.

The Roadmap to May: Preparing for the Next Sentiment Shift
As April winds down, the market is already looking toward May's Fed meeting. Here is how the 'Stagflation' narrative is evolving into the 'New Normal'.

Correlation Drift: When Gold and USD Stop Moving in Opposite Directions
Gold and the USD are moving in tandem, breaking traditional inverse relationships. Here is how to use Toastlytics to detect 'Correlation Drift' before it hits your stop-loss.

Payout Pressure: The Psychology of the End-of-Month Audit
As we approach the end of April, the pressure to hit payout targets is reaching a peak. Here is why the last 7 days of the month are the most dangerous for funded traders.

Correlations in Crisis: Why Your Diversification Failed During the Oil Spike
Traditional correlations are breaking down as Oil tests $100. Learn how to use Toastlytics to audit your cross-asset exposure before the next market shift.

Sunday Focus: The 'Stagflation' Reality Check
The word 'Stagflation' is dominating the airwaves. As we prep for the week, the focus shifts to how the Fed will balance slowing growth with rising energy costs.

Weekend Recap: The Ceasefire Collapse and 'Safe Haven' Flight
The temporary ceasefire in the Middle East has collapsed, leading to a fresh spike in volatility. Here is how to prepare for the Monday gap.

Flash PMIs: The Global Growth Divergence Deepens
The latest Flash PMI data is out. While the US continues to expand, European manufacturing is showing signs of a 'stagflationary' slowdown.

Corporate Earnings: The Inflation Margin Squeeze
Delta Air Lines and Constellation Brands have reported. The data shows that while demand is high, rising fuel costs are beginning to eat into corporate margins.

The Hormuz Blockade: Navigating the 'War Premium' Peak
New reports of naval skirmishes in the Strait of Hormuz have pushed Oil to test the $100 psychological barrier. Here is how the 'War Premium' is impacting asset correlations.

ADP Hiring & PPI Inflation Spike: The Stagflationary Squeeze
Strong private hiring (185k) and a hot PPI print (+0.7%) are forcing the market to re-evaluate the Fed's pivot timeline. Inflation is proving stickier than the 'Soft Landing' bulls anticipated.

The FOMC Minutes Trap: Managing Emotional Reactivity to News Shocks
Federal Reserve minutes and 'hot' CPI prints have transformed April into a psychological minefield. Learn why your brain sabotages your execution during news events.

Sunday Prep: Positioning for the Inflation Data Drop
As we look toward a massive week of inflation data (ADP & PPI), the 'Sunday Prep' is more critical than ever. Set your session rules before the Monday open.

Weekly Recap: The Tech Resurgence vs. The Energy Crisis
Amazon and TSMC earnings are driving a tech resurgence, even as the Strait of Hormuz remains a primary macro risk. Here is how the two narratives are colliding.

The Friday Flush: Auditing the 4 PM Liquidity Gap
As we close out a high-impact week, the risk of 'Headline Gaps' remains elevated. Protect your funded account with these three session rules.

The 'Higher for Longer' Reality: Auditing Institutional Drift
Following yesterday's Fed minutes, the 'higher for longer' narrative is cemented. Here is how institutional liquidity is shifting in the aftermath.
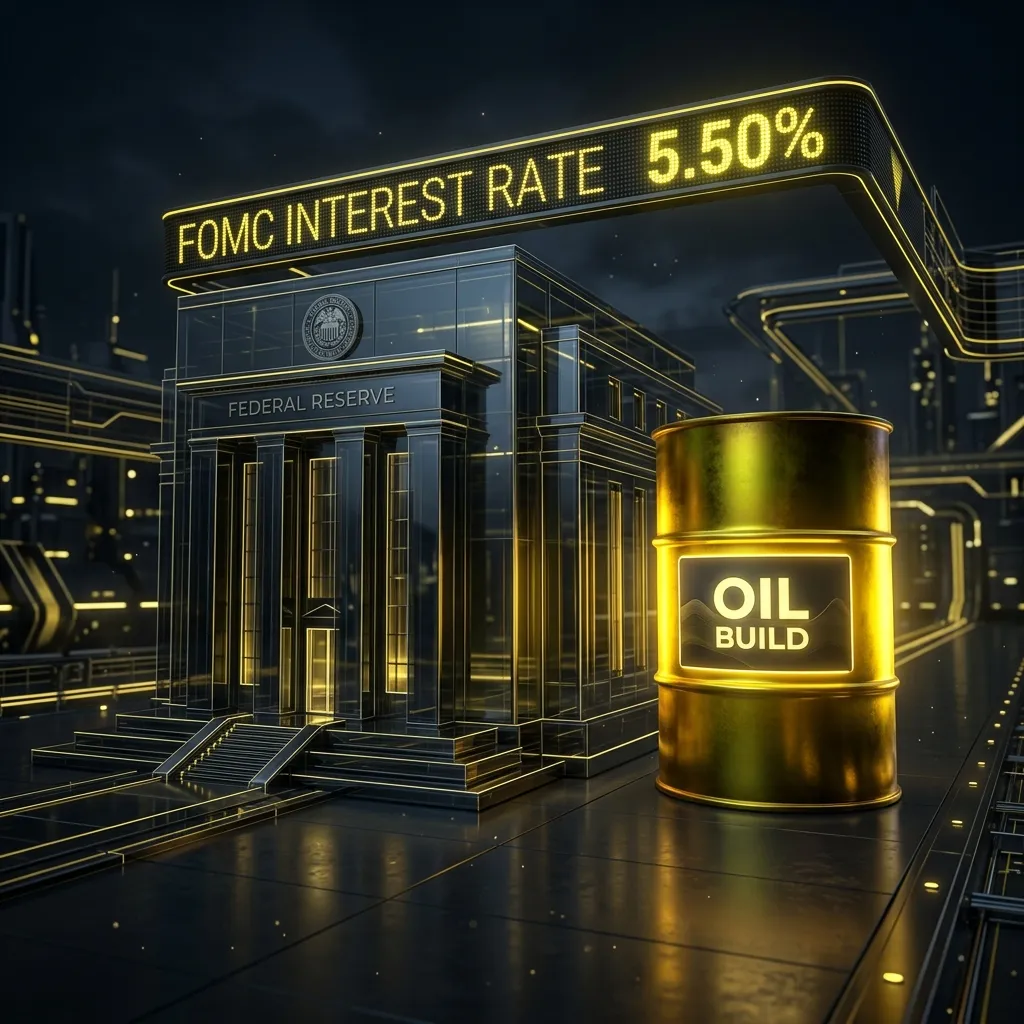
The FOMC 'Hawkish Hold' & EIA Crude Inventory Shock
The Fed keeps rates steady at 5.50% while US crude inventories see a massive 5.5M barrel build. The collision of hawkish policy and supply surplus is testing energy support levels.

Durable Goods & Ivey PMI Audit: The Growth Divergence
Durable goods orders remained flat while the Canada Ivey PMI surged to 63.8. This divergence between US manufacturing and Canadian services is creating unique cross-pair opportunities.

The Hormuz Blockade: Navigating Geopolitical Volatility with Data, Not Gut
As Brent crude nears $100 following the naval blockade of the Strait of Hormuz, traders are facing a new era of risk. Learn how to audit your strategy for stagflationary shocks.
The Naval Escalation: Sentiment Analysis for the Week Ahead
As the naval presence in the Strait of Hormuz increases, the market is bracing for a supply-side shock. Here is how to audit your sentiment bias.

US Balance of Trade: The Fundamental Floor for the USD
Fresh data shows the US trade deficit narrowing slightly in February 2026. This shift provides a fundamental floor for the US Dollar despite rising energy costs.

Weekend Briefing: Auditing the 'Hormuz Premium'
As the markets close for the weekend, the 'Hormuz Premium' is being baked into long-term options. Here is how to audit your weekend exposure.

Energy Sentiment: Why $90 Crude is the New Floor
Oil remains the primary driver of market sentiment today. With prices stabilizing above $90, the correlation between energy and inflation expectations is tightening.

Q2 Opening: The Volatility Outlook and the 'Liquidity Gap' Trap
As we enter the second quarter of 2026, the market is pricing in sustained geopolitical risk. Here is how to position your execution rules for the new volatility standard.

March Madness: How Last Month's Volatility Exposed Your Emotional Blindspots
Federal Reserve shocks, geopolitical shifts, and the resulting market tailspins made March 2026 a month for the history books. Explore how these macro events exposed the hidden errors in your trading execution.

Roadmap 2026: The Future of Emotion-Aware Trading
Get an exclusive look at the Toastlytics product roadmap for 2026. From real-time biometric integration to autonomous risk auditing, see how we are building the world's first emotion-aware trading terminal.

The Funded Trader’s Secret: How to Keep Your Account for the Long Haul
Passing a challenge is only the beginning. 80% of funded traders lose their account before the first payout. This 1,800-word guide reveals the institutional-grade defense systems of the pros.

Peak Performance: The Biology of High-Stakes Decision Making
Trading is a high-performance sport. Learn the biological foundations of focus, the role of heart-rate variability (HRV) in managing drawdown, and why your sleep is more important than your strategy.

Risk is a Feeling, Math is a Fact: The Psychology of Stops
Closing a losing trade feels like a personal failure, but the data shows it's actually your only victory. Explore the neuroscience of 'Loss Aversion' and why your intuition is a terrible manager of risk.

The Neural Edge: How Toastlytics' AI Actually Thinks
Explore the internal logic of the Toastlytics AI engine. Beyond the buzzwords, learn how deep-learning models identify hidden trading edges and predict performance decay before it happens.
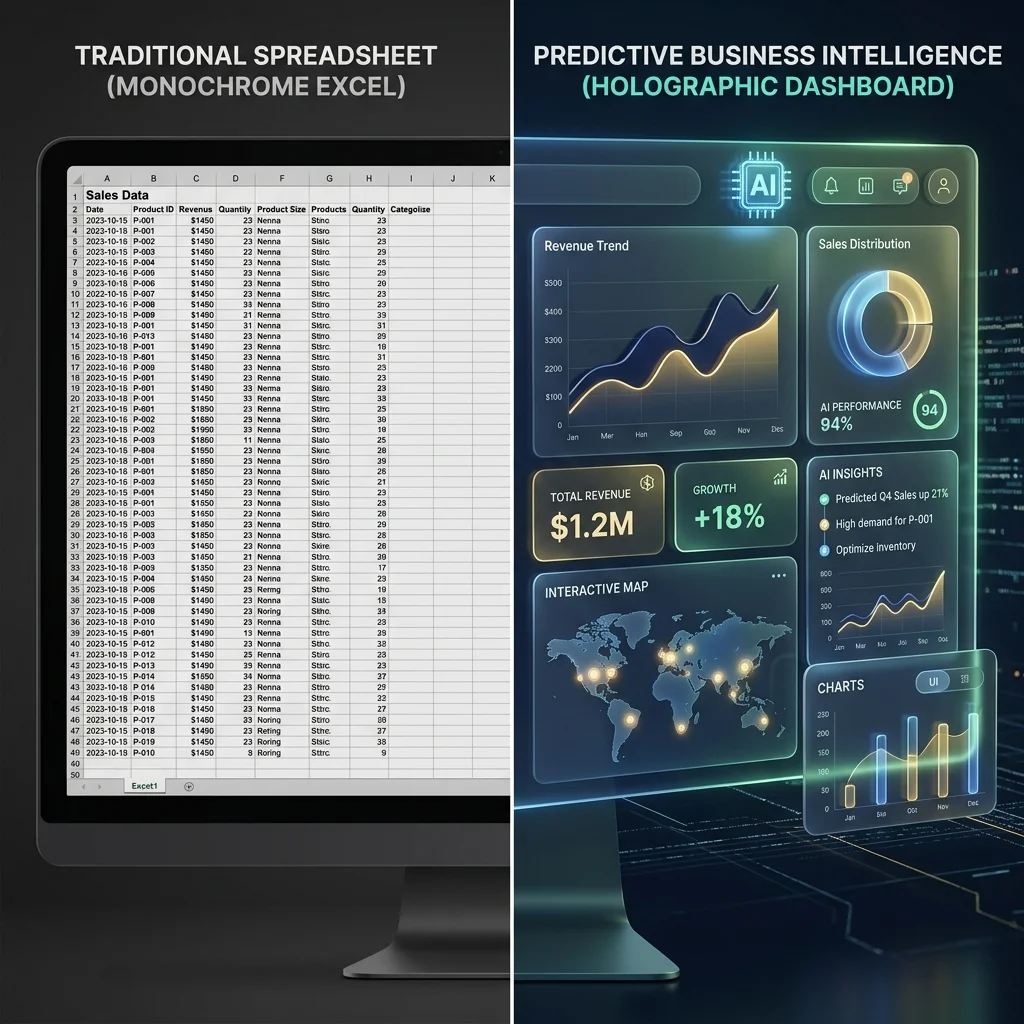
The Death of the Spreadsheet: Why Manual Trading Journals are Sabotaging Your Growth
Manually entering rows into Excel is more than just slow—it's a form of performance sabotage. This 1,800-word guide breaks down the math of 'Data Friction' and how AI is finding the edge you're missing.

The $100k Reset: How Data Saved a Funded Account from the Brink
Explore the real-world case study of a $100,000 funded trader who hit a 4% drawdown in 48 hours—and how a single data-driven pivot saved the account from total liquidation.

The Ghost in the Machine: How AI Detects Your Fear Before You Do
Your heart rate spikes, your breathing gets shallow, and your logic vanishes. Explore how AI identifies the neurological markers of a failing strategy and how to use data to stay in 'Flow'.

Why 97% of traders lose — and the one thing that actually fixes it
The strategy isn't the problem. Your emotional patterns are. We analysed thousands of trade journals to find the exact behaviours that separate profitable traders from the rest.

The Prop Firm Blueprint: How to Pass Any Funding Challenge in 2026
Passing a $100k challenge isn't about finding a 90% win rate strategy. It's about mathematical risk management and staying under the radar of the drawdown algorithm.
The Neurobiology of Risk: Why Emotion Tracking is the Final Frontier of Trading
Pure technical analysis only gets you 40% of the way. The rest is biological management. This 1,800-word guide breaks down the neurobiology of trading and how to track it.

Profit factor explained: why win rate alone is a dangerous metric
A trader with a 40% win rate can be more profitable than one with 70%. Understanding profit factor is the first step to reading your edge accurately.

R:R ratio guide — how to size positions so one win covers three losses
Most retail traders have no idea what their average R:R is. Here's how to calculate it, benchmark it, and systematically improve it.
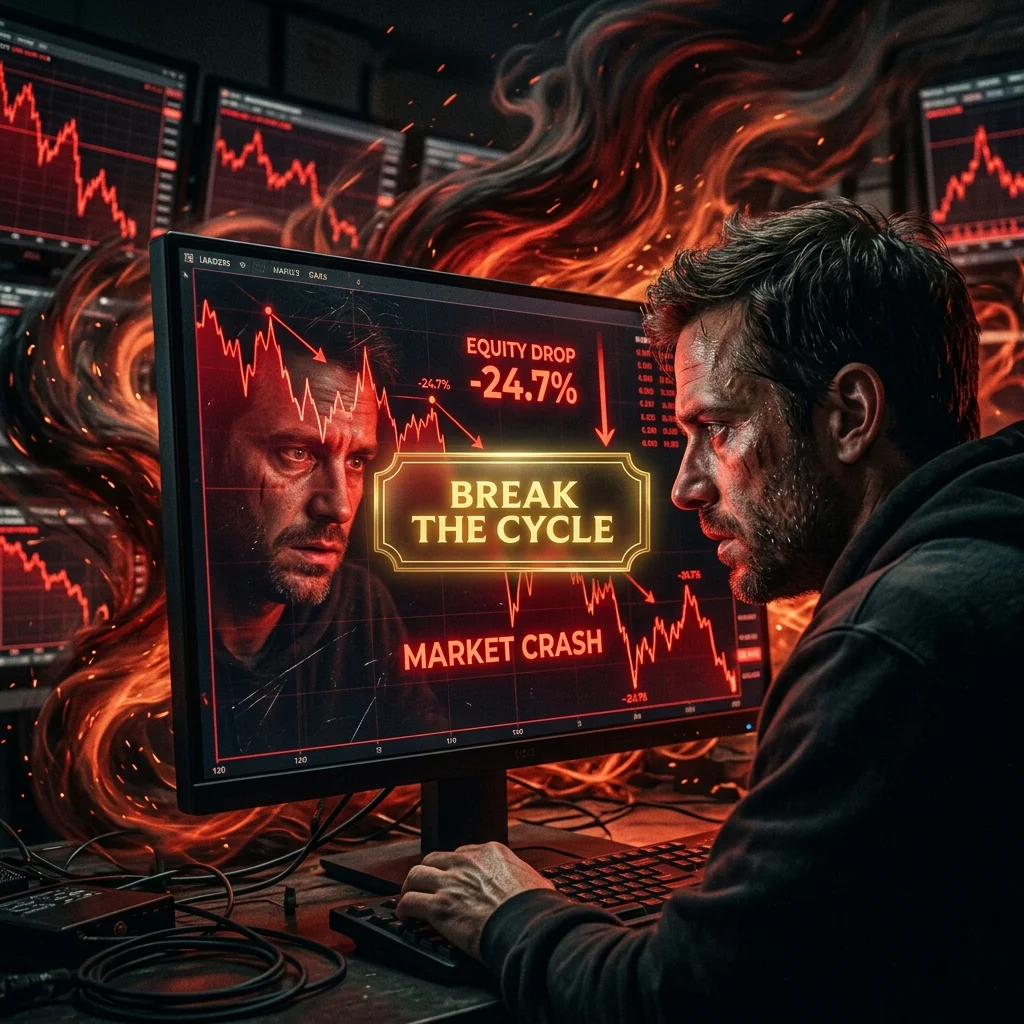
The Psychology of Losing Streaks: How to Stop Revenge Trading
Revenge trading is responsible for more blown accounts than any other single behaviour. Learn the neurobiology of 'Tilt' and how to use data to break the cycle permanently.

The Ultimate Trading Journal Guide: How to Turn Data into a Professional Edge
Most traders fail because they treat journaling as a diary. This 2,500-word research-backed guide shows you how to treat it as a profit-generation machine.

MAE & MFE explained: are you exiting trades too early or holding too long?
Maximum Adverse Excursion and Maximum Favourable Excursion reveal the hidden cost of your exit timing. Most traders are leaving significant money on the table.