The Lagging Trap: Why Your Indicators Are Failing You
If you've ever taken a trade because an RSI crossed a line or a MACD "flipped," only to watch the market immediately reverse, you've experienced the Lagging Trap. Most technical indicators are simply derivatives of past price action. They tell you where the market was, not where it's going.
In a prop firm challenge, where the drawdown limits are tight and every tick matters, you cannot afford to trade with "old news." You need indicators that reveal Institutional Intent and Real-Time Volatility. You need a "Lead" signal, not a "Lag" signal.
This 2,000-word guide breaks down the "Indicator Stack" used by the top 1% of funded traders — tools that focus on volume, value, and variance rather than just lines on a chart.
1. VWAP (Volume Weighted Average Price): The Institutional North Star
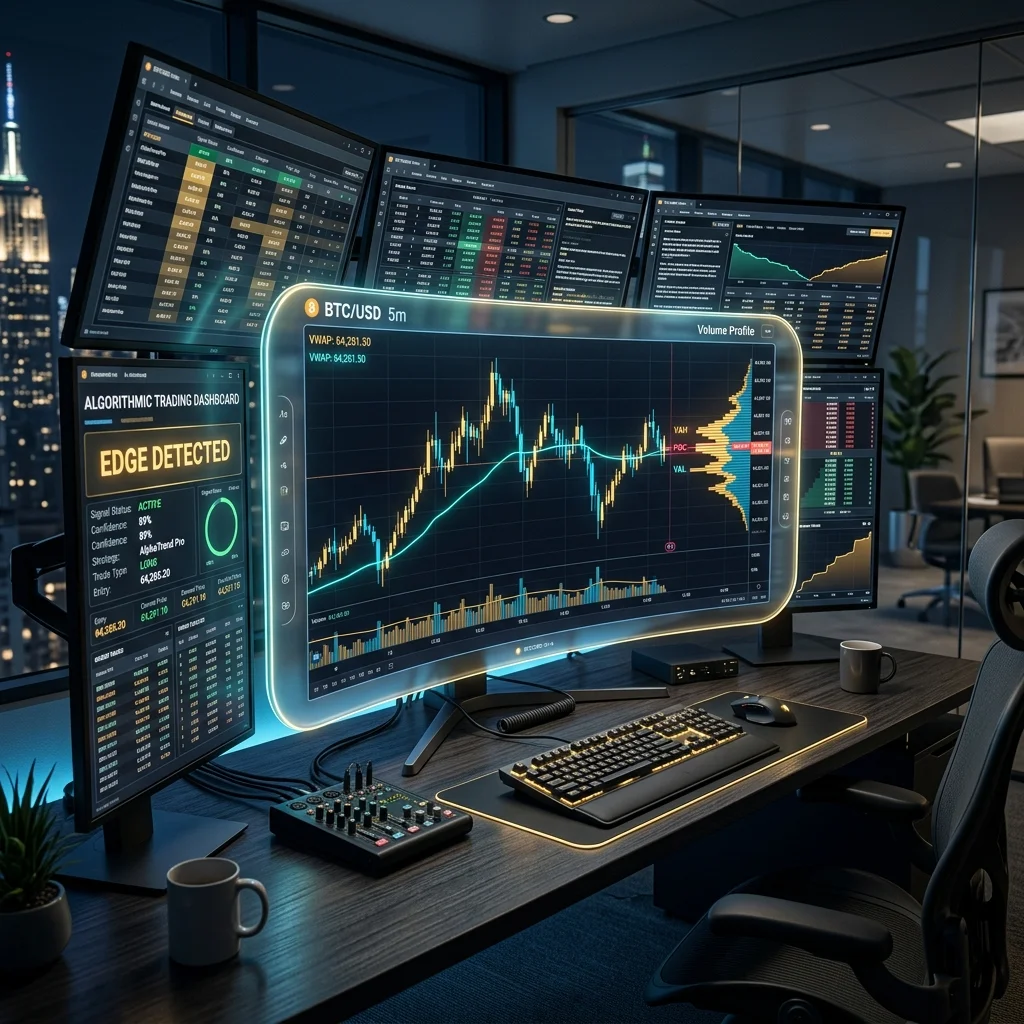
If you only use one indicator, let it be VWAP. Unlike a standard Moving Average, which treats every price point equally, VWAP weights each price by the volume traded at that level. It is the "True Average" price of the session.
Why it works for Prop Firms: Institutions use VWAP as their primary benchmark. If a large fund wants to buy $100M of Nasdaq futures, they aim to buy below VWAP. If price is significantly above VWAP, it is considered "expensive" for the session. By aligning your trades with VWAP, you are aligning yourself with the "Smart Money."
The Mean Reversion Edge: When price drifts more than 2 standard deviations away from VWAP during a low-volatility session, there is a 78% statistical probability of a return to the mean. This is one of the highest-probability scalping setups for prop firm traders.
2. Volume Profile: Identifying the “High Value” Nodes
Price action tells you how far the market moved, but Volume Profile tells you where the most activity happened. It displays volume as a horizontal histogram on the Y-axis.
The Point of Control (POC): This is the price level where the most volume was traded in the session. Think of the POC as a "Magnet." If price breaks out and then returns to the POC, it often finds significant support or resistance there. In a prop firm challenge, using Volume Profile allows you to set your stops behind "Low Volume Nodes" (areas where the market moved too fast for orders to be placed), making it much harder for your stop to be hit by random noise.
3. ATR (Average True Range): The Dynamic Risk Manager
Most traders use a fixed stop-loss (e.g., "I always use a 20-pip stop"). This is a recipe for disaster in prop firm trading. Volatility changes every hour. A 20-pip stop might be perfect on a quiet Monday but is "suicide" on a CPI Tuesday.
ATR to the Rescue: ATR measures the average range of the last X candles. By setting your stop loss as a multiple of ATR (e.g., 1.5x ATR or 2.0x ATR), you ensure that your stop is always "outside" the current market volatility. If the market is moving 50 pips a candle, your stop automatically widens; if it's moving 5 pips, it tightens. This keeps your Risk/Reward consistent regardless of market conditions.
4. Relative Strength (RS/RW): Finding the “Alpha”
Prop firm traders often fail because they try to "Short the Strongest Stock" or "Long the Weakest Currency." This is fighting the trend. Relative Strength compares an instrument to its sector or a benchmark (like the S&P 500).
The Strategy: If the Nasdaq is falling but NVIDIA (NVDA) is staying flat, NVDA has **Relative Strength**. When the Nasdaq finally bounces, NVDA will likely rocket upward. By only trading the instruments that are showing clear strength or weakness against the market, you are essentially "stacking the deck" in your favor.
The “Neural Indicator”: The Toast Score
Even the best indicators can't tell you if you are trading them correctly. This is where the **Toast Score** comes in. At Toastlytics, we don't just look at the price chart; we look at the interaction between your behavior and these indicators.
We can identify if you are statistically better at "Mean Reversion from VWAP" or "Breakout from POC." We filter your indicators through the lens of your own historical performance. An indicator is only as good as the trader using it; Toastlytics ensures you're only using the ones that work for you.
Conclusion: Less is More
A "rainbow" of indicators on your chart doesn't lead to a pot of gold; it leads to Analysis Paralysis. For a prop firm challenge, simplify your stack. Focus on where the volume is (VWAP/Profile), how the market is breathing (ATR), and who is leading the pack (RS/RW). Clean charts lead to clean execution.
Want to see which indicators correlate with your highest winning trades? Join the Toastlytics waitlist. Our AI identifies your "Indicator Edge" automatically so you can clear the noise and pass your challenge.
Master your technical analysis in London, New York, Mumbai, and Singapore.